LangGraph is a library created to make it easier to create stateful, multi-agent applications that make use of Large Language Models (LLMs). By expressing complex agent operations as cyclic graphs, it makes it possible to create more dynamic and adaptable behaviors than conventional linear execution models.
Creating and managing chat state graphs can be challenging, but with tools like StateGraph from the langgraph library, you can seamlessly build and visualize complex workflows. This post walks you through a simple example to illustrate how to define custom nodes and edges in a state graph and visualize it using multiple formats.
Prerequisites
Before diving into the code, ensure you have the following Python libraries installed:
pip install langgraph grandalfBuilding the Graph
Here’s the core code that constructs a simple state graph, including custom nodes and transitions:
from IPython.display import Image
from typing_extensions import TypedDict
from langgraph.graph import StateGraph, START, END

class State(TypedDict):
    "State to manage all chats"

class MyNode:
    "Custom Node"

# Initialize the graph builder with a state
builder = StateGraph(State)

# Add a custom node
builder.add_node("myNode", MyNode)

# Define the edges for transitions
builder.add_edge(START, "myNode")
builder.add_edge("myNode", END)

# Compile the graph
chat_graph = builder.compile()
Mermaid PNG
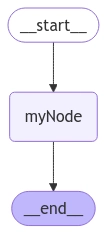
This can be rendered directly in a Jupyter Notebook using
IPython.display.Image

Image(chat_graph.get_graph().draw_mermaid_png())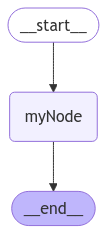
ASCII
The ASCII output provides a minimal yet clear visualization of the node transitions.
print(chat_graph.get_graph().draw_ascii())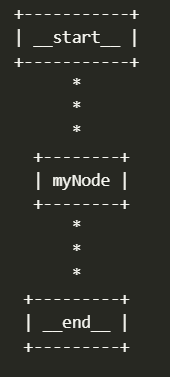
Mermaid Code
The draw_mermaid() function outputs the source code for a Mermaid
diagram.print(chat_graph.get_graph().draw_mermaid())%%{init: {'flowchart': {'curve': 'linear'}}}%%
graph TD;
__start__([__start__]):::first
myNode(myNode)
__end__([__end__]):::last
__start__ --> myNode;
myNode --> __end__;
classDef default fill:#f2f0ff,line-height:1.2
classDef first fill-opacity:0
classDef last fill:#bfb6fcYou can copy the Mermaid code from the terminal and visit mermaid.live. Paste the code into the Code section, and you will see the graph rendered under the Diagram section.
Conclusion
StateGraph is a powerful tool for managing and visualizing state transitions in a chat workflow. By combining custom nodes, edges, and flexible visualization options, it simplifies the process of understanding and debugging complex state machines.