Redis is often a critical part of modern infrastructure — whether used as a cache, message broker, or ephemeral store. Monitoring it properly helps you detect issues early and ensure system stability.
In this guide, you’ll learn how to build a Redis monitoring dashboard with Prometheus and Grafana to quickly identify issues and improve system reliability.
⚙️ Installing Prometheus (Quick Setup)
We’ll start by deploying Prometheus using Helm:
helm repo add prometheus-community https://prometheus-community.github.io/helm-charts
helm repo update

helm install kube-prometheus prometheus-community/kube-prometheus-stack \
  --namespace prometheus --create-namespace
This will install Prometheus, Grafana, and some built-in exporters.
To access Grafana:
kubectl port-forward svc/kube-prometheus-grafana -n prometheus 3000:80You can access here -> http://localhost:3000/login
Default login: admin / prom-operator
🧱 Installing Redis
helm repo add bitnami https://charts.bitnami.com/bitnami
helm repo update

helm install redis bitnami/redis \
  --namespace app-stg \
  --set architecture=standalone \
  --set auth.enabled=false \
  --create-namespace
This installs a standalone Redis with no password, perfect for testing.
After this, you can point the Redis Exporter and your application to the correct Redis service. The hostname will be:
redis-master.app-stg.svc.cluster.local:6379📦 Installing Redis Exporter
Now let’s deploy the Redis Exporter:
helm install redis-exporter prometheus-community/prometheus-redis-exporter \
  --namespace prometheus \
  --set serviceMonitor.enabled=true \
  --set serviceMonitor.namespace=prometheus \
  --set serviceMonitor.interval=15s \
  --set serviceMonitor.labels.release=kube-prometheus \
  --set redisAddress=redis://redis-master.app-stg.svc.cluster.local:6379 \
  --create-namespace
The Redis Exporter exposes metrics at a Prometheus-compatible /metrics endpoint.
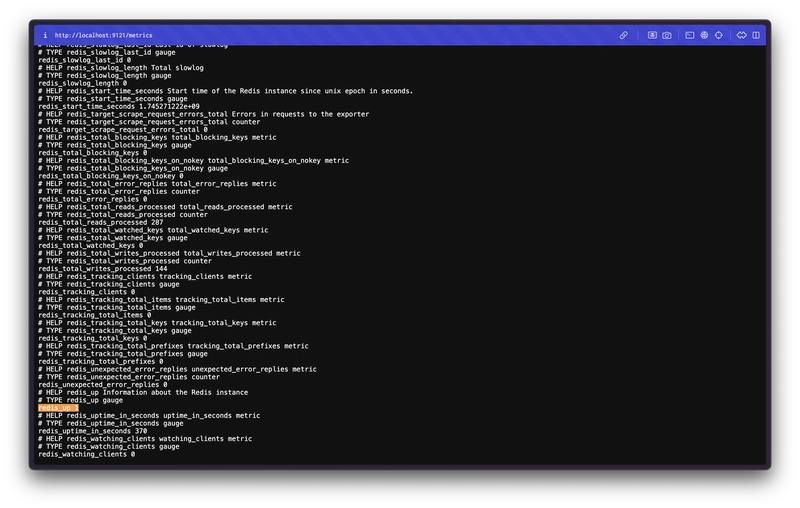
kubectl port-forward svc/redis-exporter-prometheus-redis-exporter -n prometheus 9121:9121Then open: http://localhost:9121/metrics
You should see a long list of metrics like this:

✅ redis_up 1 means the exporter is connected to a Redis instance and it’s healthy.
🚫 redis_up 0 means the exporter failed to connect — check the Redis address or service availability.
If everything is working, you’ll also see metrics like:
- redis_connected_clients
- redis_memory_used_bytes
- redis_total_commands_processed
🔍 Checking in Prometheus
To validate that Prometheus is collecting Redis metrics:
kubectl port-forward svc/kube-prometheus-kube-prome-prometheus -n prometheus 9090Open http://localhost:9090, go to Status > Targets, and check that Redis Exporter is listed and UP.
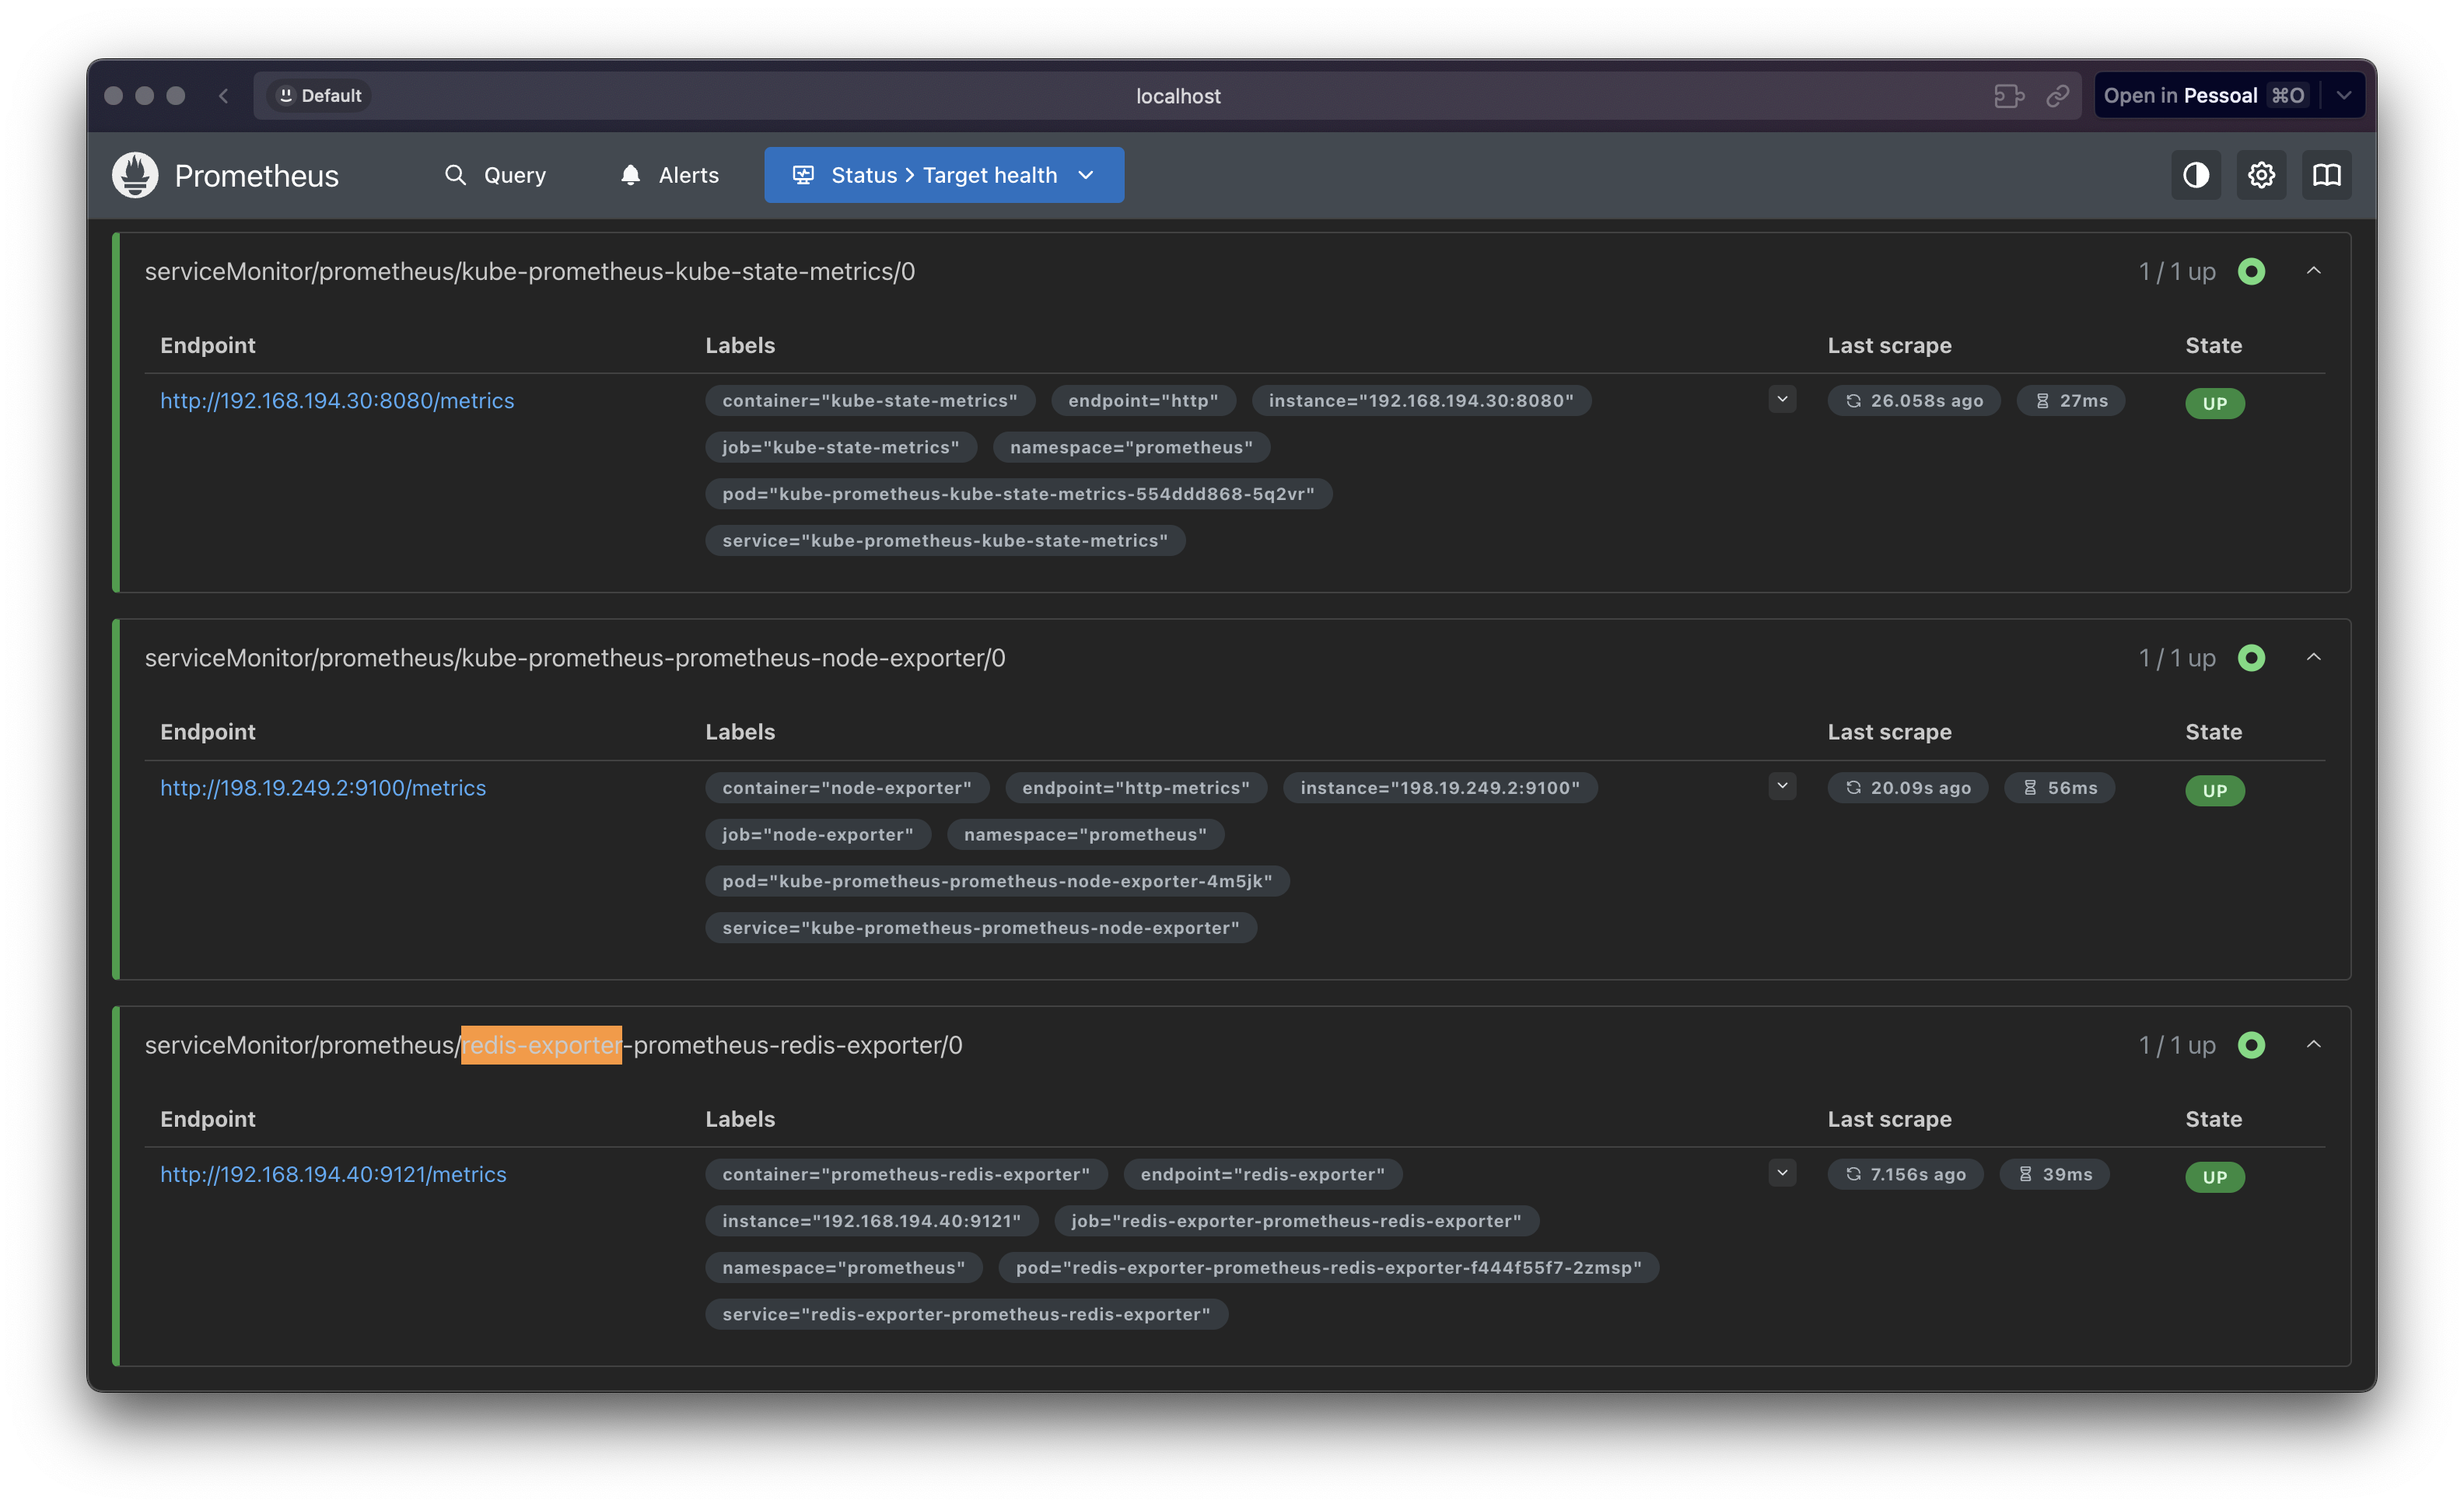
Everything is working right!
📊 Importing the Redis Dashboard on Grafana
To visualize your Redis metrics in a clean and ready-to-use panel, you can import a community-maintained dashboard from Grafana Labs.
https://grafana.com/grafana/dashboards/14091-redis-dashboard-for-prometheus-redis-exporter-1-x/
🧭 How to Import
- Access Grafana by establishing port forwarding and navigating to http://localhost:3000 in your browser
- Navigate to the "+" icon in the left sidebar and select "Import"
- Enter the dashboard ID or URL in the provided field and click "Load"
- Click "Import" to finalize the installation
Allow a few moments for the system to process your request as the metrics populate on your dashboard
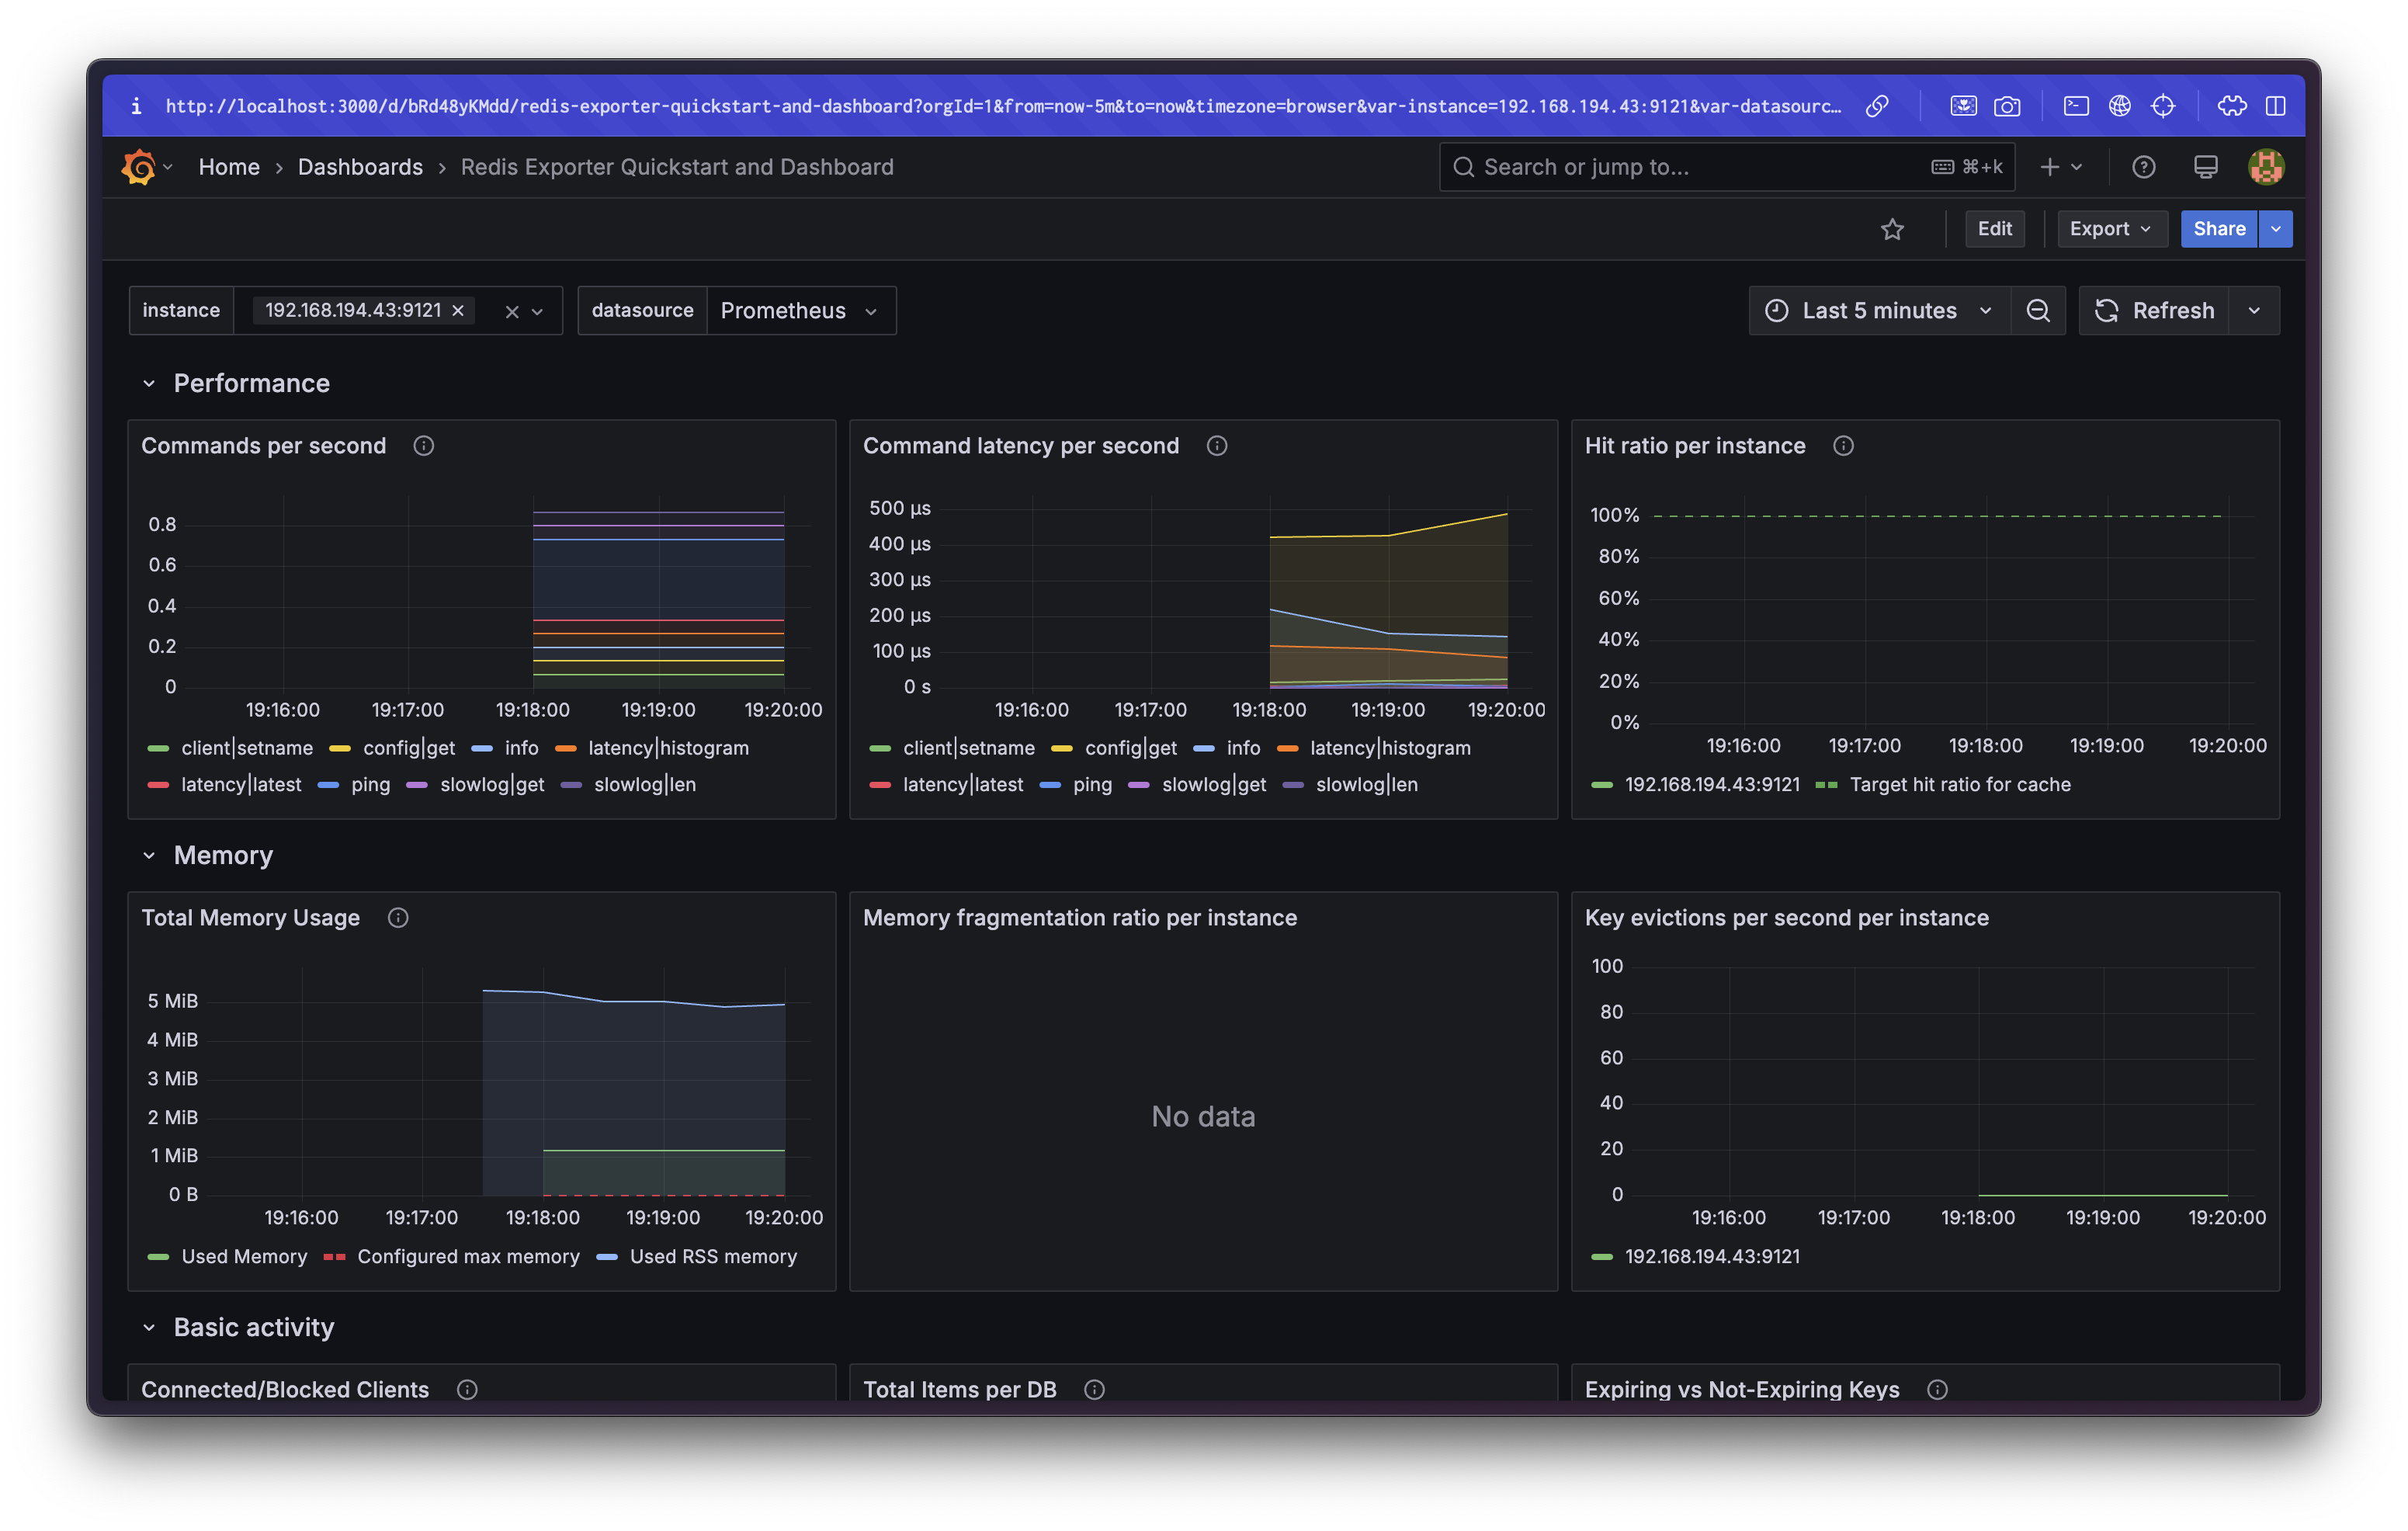
Thats it!
⎈Happy Helming!⎈