tl;dr: alloy config, docker-compose.
Any service that's meant to live more than couple of weeks eventually reaches the stage where you feel the need to properly monitor it. You usually start with simple console.log logging, but soon realize it's not readable enough, it's not searchable enough and it's only available on your server. Probably inside Docker container.
I was exactly at that point, annoyed by constant need to ssh into my server to check one log line. I've wanted to play with Grafana ecosystem for a while, too. So it seemed to be the perfect moment.
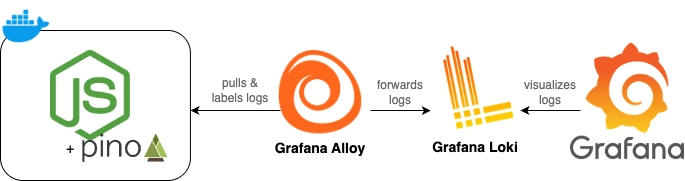
In this post, I’ll walk you through a simple and minimal setup that streams my Node.js application's logs into the Grafana Cloud dashboard using Grafana Alloy and Loki.
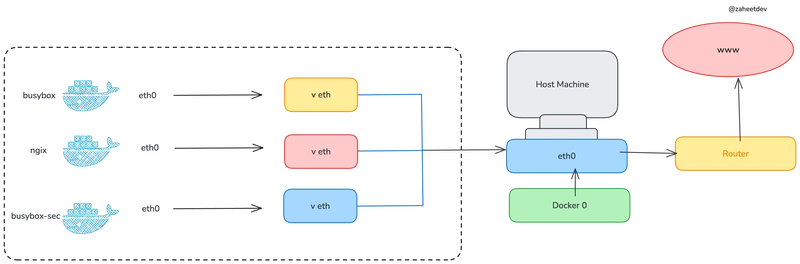
This is what my final setup looks like:

Now let’s break down how to make it work.
Producing Logs
I'm using pino to generate logs from my service. I won't dive deep into the setup as the library outputs raw JSON to stdout by default. An example log line would look like this:
{"level":30,"time":1746117737323,"pid":45,"hostname":"96773881a0b3","module":"server.js","env":"development","msg":"Server is running"}Docker’s default logging behavior captures all stdout and stderr from your container and writes them into a file. json-file is the default logging driver in Docker, you can confirm this using:
docker info --format '{{.LoggingDriver}}'You can also find out the actual log file location for a specific container:
docker inspect -f '{{.LogPath}}'And this exactly what Alloy will be reading and forwarding to Grafana Cloud.
Onboarding to Grafana Cloud and Setting Up Loki
Before we start wiring things up locally, let's prepare the Grafana Cloud workspace.
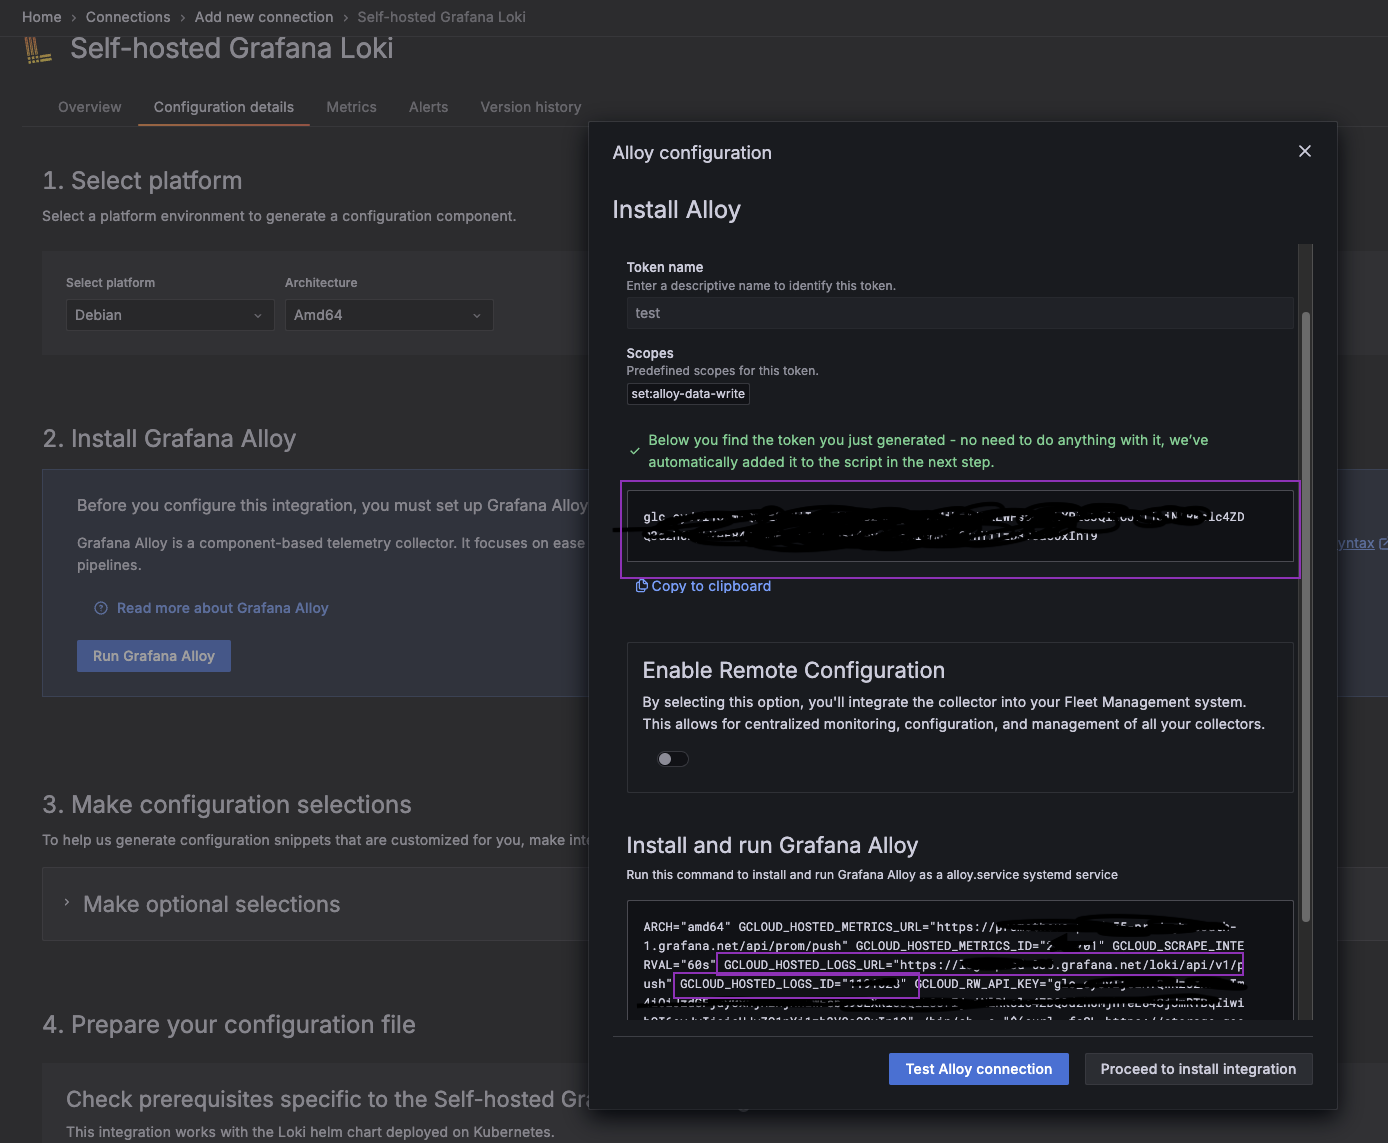
Navigate to Grafana Cloud and sign up or log in. In the sidebar, select Connections → Add new connection, select Loki. This is the place that prompts you to set up your Loki connection and allows you to generate an access token for Alloy.
In section 2, Install Grafana Alloy, click the "Run Grafana Alloy" button to retrieve necessary information. We're interested in the token, Loki username (GCLOUD_HOSTED_LOGS_ID) and Loki URL (GCLOUD_HOSTED_LOGS_URL). You'll need them later to set up Alloy config.
Setting Up Alloy Config
The configuration for the collector is stored in a file with *.alloy extension. Let's create config.alloy in the project root.
// Step 1. Discover Docker containers and extract metadata.
discovery.docker "linux" {
  host = "unix:///var/run/docker.sock"
}

// Step 2. Extract a service name from the container name using a relabeling rule.
discovery.relabel "logs_integrations_docker" {
  targets = discovery.docker.linux.targets

  rule {
    source_labels = ["__meta_docker_container_name"]
    regex = "/(.*)"
    target_label = "service_name"
    }
}

// Step 3. Collect logs from Docker containers together with relabel information and forward to Loki receiver.
loki.source.docker "default" {
  host = "unix:///var/run/docker.sock"
  targets = discovery.relabel.logs_integrations_docker.output
  labels = {"platform" = "docker"}
  forward_to = [loki.write.cloud.receiver]
}

// Step 4. Send logs to Grafana Cloud Loki.
loki.write "cloud" {
  endpoint {
    url = sys.env("GRAFANA_LOKI_URL")
    basic_auth {
      username = sys.env("GRAFANA_LOKI_USERNAME")
      password = sys.env("GRAFANA_CLOUD_API_KEY")
    }
  }
}
This config basically defines a pipeline of operations Alloy performs to collect, transform and deliver the data. In our case, we want to send logs from Docker to Grafana Cloud Loki. To do that, we'll pass the credentials you got earlier to config - using environment variables for safety.
💡 Tip: Grafana has a great Alloy scenarios repo with examples for different setups and logs sources. It helped me a lot in understanding how the pieces fit together.
Putting It All Together in Docker Compose
Since I’m already using docker-compose to run my service, integrating Alloy was as simple as adding another service definition.
services:
    app:
        build: .
        environment:
            NODE_ENV: ${NODE_ENV}
        ports:
            - '8080:8080'

    alloy:
        image: grafana/alloy:latest
        container_name: alloy
        ports:
            - '12345:12345'
        volumes:
            # mount config file
            - './config.alloy:/etc/alloy/config.alloy'
            # give access to running docker containers for discovery.docker
            - /var/run/docker.sock:/var/run/docker.sock
            # give access to docker's log files directory (optional)
            - /var/lib/docker/containers:/var/lib/docker/containers:ro
        environment:
            # pass environment variables for config.alloy
            GRAFANA_LOKI_URL: ${GRAFANA_LOKI_URL}
            GRAFANA_LOKI_USERNAME: ${GRAFANA_LOKI_USERNAME}
            GRAFANA_CLOUD_API_KEY: ${GRAFANA_CLOUD_API_KEY}
        command:
            - run
            - --server.http.listen-addr=0.0.0.0:12345
            - --storage.path=/var/lib/alloy/data
            - /etc/alloy/config.alloy
The Grafana Cloud credentials might be stored in a .env file on your server.
Run and Verify
Let's build and run the containers using docker-compose up -d and verify everything is up by looking at the docker ps output:

If both containers are up and healthy and there are no errors in logs, you can proceed to the Grafana Portal to verify the updates are reaching the Cloud.
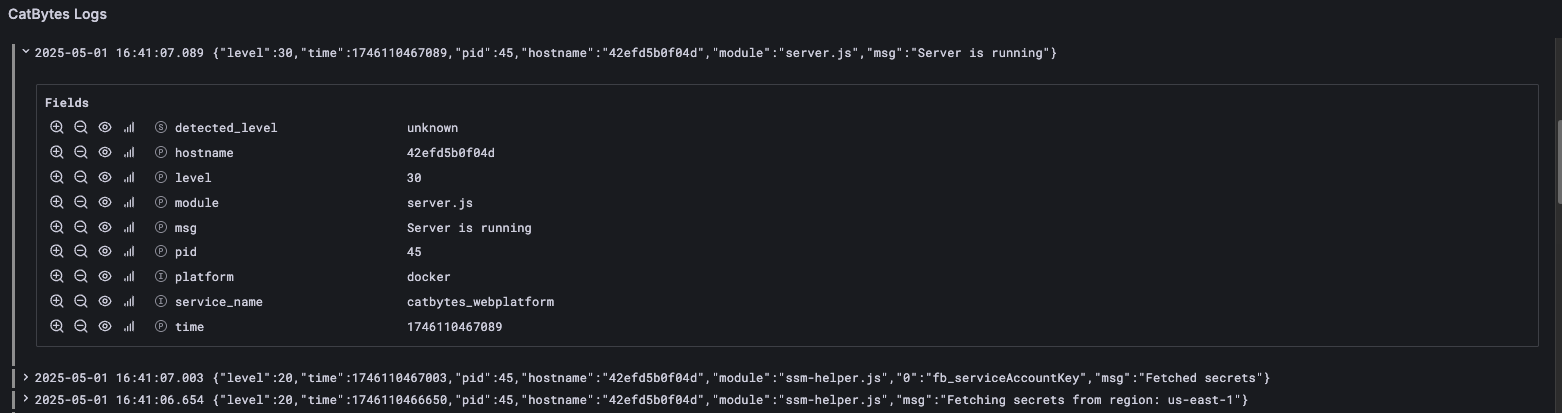
Navigate to Explore, select your data source (Loki) and apply filters. The service_name filter label comes from the relabelling step in the Alloy pipeline, so now you can easily search logs for your specific service.
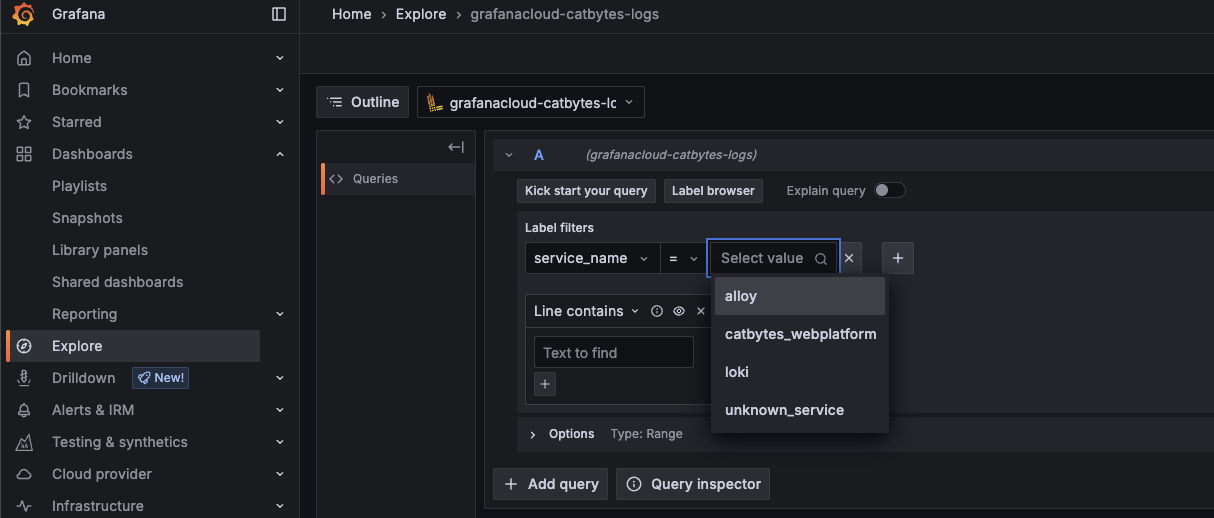
And just like that - the logs are flowing! You can play more with additional filtering and processing, for now I just added a basic JSON parsing for more readable output.
What’s Next?
I’m still getting familiar with Grafana Dashboards, so there’s more to explore. In particular:
- Pino logs use numeric levels (e.g. 30, 40), which aren’t parsed as human-readable levels by default in Grafana;
- I’d love to build some fancy filters and dashboards to better visualize logs;
- I'm eager to try pino-http logging and see how it can be visualized in Grafana.
These will probably be another blog post(s), so stay tuned :) Thanks for reading and I'd love to hear any suggestions or comments you may have!