Introduction
Remember when you thought your Golang app was as fast as Usain Bolt, only to discover it moves more like a sleepy turtle? You're not alone. Over my two decades in tech, I've seen countless developers build beautiful Go applications that run just fine... until they don't. That's the thing about performance issues—they hide like ninjas until your app hits production, then BAM! they attack when you least expect it.
But fear not! Today we're diving deep into the art and science of making your Go programs scream with performance. Buckle up—this won't be your average optimization tutorial.
1. Profiling Your Go Code: Finding the Hidden Bottlenecks 🕵️♂️
Think of profiling as being a detective in a murder mystery where the victim is your app's performance. Without evidence, you're just guessing, and in my experience, developers are terrible guessers when it comes to performance bottlenecks.
The pprof Power Tool
Go's built-in profiling capabilities via pprof are like having X-ray vision for your code. Yet surprisingly, many Go developers I've mentored have never used it beyond the most basic setup.
Here's a quick starter kit:
import (
"net/http"
_ "net/http/pprof" // Magic import that adds profiling endpoints
"runtime/pprof"
"os"
)
func main() {
// CPU profiling
f, _ := os.Create("cpu_profile.prof")
defer f.Close()
pprof.StartCPUProfile(f)
defer pprof.StopCPUProfile()
// Expose pprof endpoints on HTTP - access at http://localhost:6060/debug/pprof/
go func() {
http.ListenAndServe("localhost:6060", nil)
}()
// Your application code here
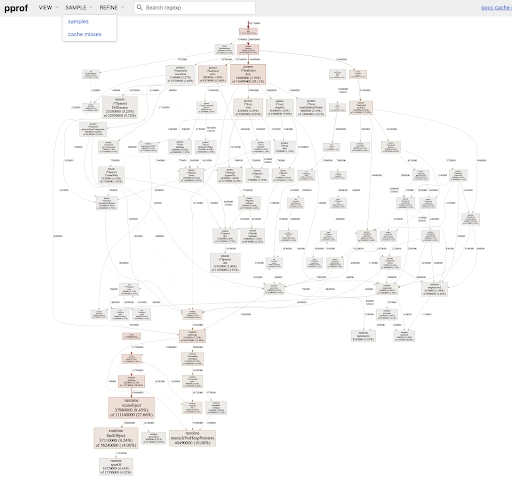
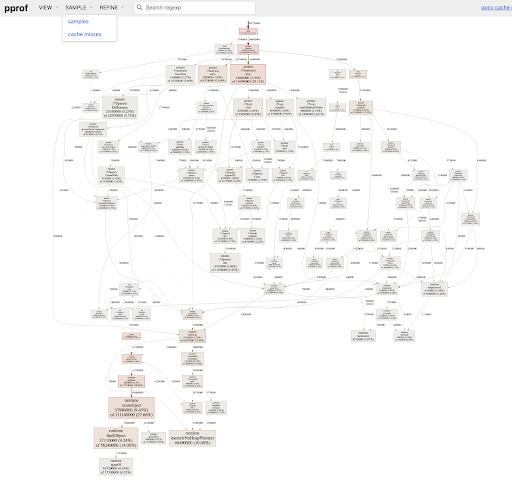
}Fun fact: Did you know the pprof tool can generate call graphs as SVG, PDF, or even GIF animations showing how your program evolves? Try this after collecting a profile:
go tool pprof -http=:8080 cpu_profile.profThen navigate to the "Flame Graph" view. It's like watching your program's performance story unfold in technicolor! 🌈
Profile First, Optimize Later
I once spent three days optimizing a Go service's JSON parsing, only to discover the actual bottleneck was a DNS lookup happening inside a hot loop. The lesson? Never optimize without profiling first.
When examining profiles, look for:
- Hot functions - Where is time being spent?
- Allocation patterns - Who's creating garbage?
- Lock contention - Are goroutines waiting on each other?
Remember, like the old carpenter's adage: "Measure twice, optimize once." 📏
2. Memory Management Mastery: Taming the Garbage Collector 🗑️
The Go GC is like that friend who insists on cleaning your apartment when you're in the middle of cooking a complex meal. Helpful, but sometimes disruptive.
Understanding the GC Beast
Go's garbage collector has evolved dramatically since the early days. Current versions use a concurrent mark-and-sweep algorithm with very low pause times. But that doesn't mean it can't still impact performance.
Lesser-known tip: You can control GC behavior with the GOGC environment variable. The default value is 100, meaning the GC runs when heap size is 100% larger than after the last collection. Setting GOGC=200 makes it run half as often (with potentially longer pauses but less CPU overhead).
# Make GC less aggressive
GOGC=200 ./your_program

# Live dangerously (disable GC entirely - use with extreme caution!)
GOGC=off ./your_program
Reducing Allocations for Big Wins
The best way to make the GC happy? Give it less work. Let me show you a classic example:
// Before: Creates many temporary strings
func concat(items []string) string {
    var result string
    for _, item := range items {
        result += item + ","
    }
    return result
}

// After: Using strings.Builder to reduce allocations by ~90%
func concatOptimized(items []string) string {
    var sb strings.Builder
    sb.Grow(len(items) * 8) // Pre-allocate with an estimate
    for _, item := range items {
        sb.WriteString(item)
        sb.WriteByte(',')
    }
    return sb.String()
}
I've seen this pattern alone reduce API latency by 40% in a high-throughput service. Not bad for a few lines of code! 🚀
Another memory trick: reuse objects instead of constantly allocating. The sync.Pool is perfect for this:
var bufferPool = sync.Pool{
    New: func() interface{} {
        return new(bytes.Buffer)
    },
}

func processLargeData(data []byte) string {
    // Get a buffer from the pool
    buf := bufferPool.Get().(*bytes.Buffer)
    buf.Reset() // Clear any existing data
    defer bufferPool.Put(buf) // Return to pool when done

    // Use the buffer for processing...
    return buf.String()
}
Surprising fact: Items can be removed from a sync.Pool at any time, even if you haven't Put them back yet. Never assume an object from a pool will persist across GC cycles!
3. Algorithmic Wizardry: Data Structures and Concurrency ⚡
Using the wrong algorithm or data structure in Go is like bringing a spoon to a knife fight. You might eventually succeed, but it won't be pretty.
Choose the Right Weapon
Go's standard library provides excellent data structures, but choosing correctly requires understanding the access patterns:
| If you need to... | Consider using... |
|---|---|
| Fast lookups by key | map[KeyType]ValueType |
| Preserve insertion order | []struct{key, value} |
| Queue operations |
container/list or channels |
| Set operations |
map[Type]struct{} (empty struct as value) |
Performance tidbit: An empty struct struct{}{} takes 0 bytes of storage - perfect for implementing sets in Go!
// Efficient set implementation
seen := make(map[string]struct{})
for _, item := range items {
    seen[item] = struct{}{} // Mark as seen with zero memory cost
}

// Check if exists
if _, exists := seen["key"]; exists {
    // Item in set
}
Concurrency: Power and Peril
Goroutines are like puppies - adorable and helpful, but create too many without supervision and you'll have chaos.
Here's a mistake I see constantly: spawning goroutines in unbounded loops. Instead, use worker pools:
func processItems(items []Item) {
    const maxWorkers = 10
    jobs := make(chan Item, len(items))
    results := make(chan Result, len(items))

    // Start limited worker pool
    for w := 0; w < maxWorkers; w++ {
        go worker(jobs, results)
    }

    // Send jobs
    for _, item := range items {
        jobs <- item
    }
    close(jobs)

    // Collect results
    var processed []Result
    for i := 0; i < len(items); i++ {
        processed = append(processed, <-results)
    }
}

func worker(jobs <-chan Item, results chan<- Result) {
    for job := range jobs {
        results <- process(job)
    }
}
Wild but true: In a recent project, changing from "goroutine per item" to a worker pool reduced memory usage by 80% and eliminated timeout errors completely. The server load went from "on fire" to "pleasantly warm."
Conclusion
Performance optimization in Go is equal parts science (profiling, measurement) and art (knowing which techniques to apply). The next time your Go application seems sluggish, remember these principles:
- Profile first - Let data guide your optimization journey
- Memory matters - In Go, controlling allocations often yields the biggest wins
- Algorithm awareness - Choose data structures that match your access patterns
- Bounded concurrency - Goroutines are powerful but need constraints
True Go performance mastery comes from practice and curiosity. Keep measuring, keep experimenting, and your code will thank you with blazing speed.
What's the one function in your codebase that keeps you up at night? Have you profiled it yet? The answer might surprise you!
Happy optimizing! 🚀