If you've spent time in both the React and Vue ecosystems, especially when building data-intensive applications, you might have noticed that the React world seems spoiled for choice when it comes to sleek, modern, and easy-to-integrate charting libraries.
As a developer primarily working with Vue and Nuxt, I feel this gap is much larger than it should be. We need more sleek chart designs and other ways to visualize data effectively. Think of Tremor Labs; we all want to use it, but we can't.
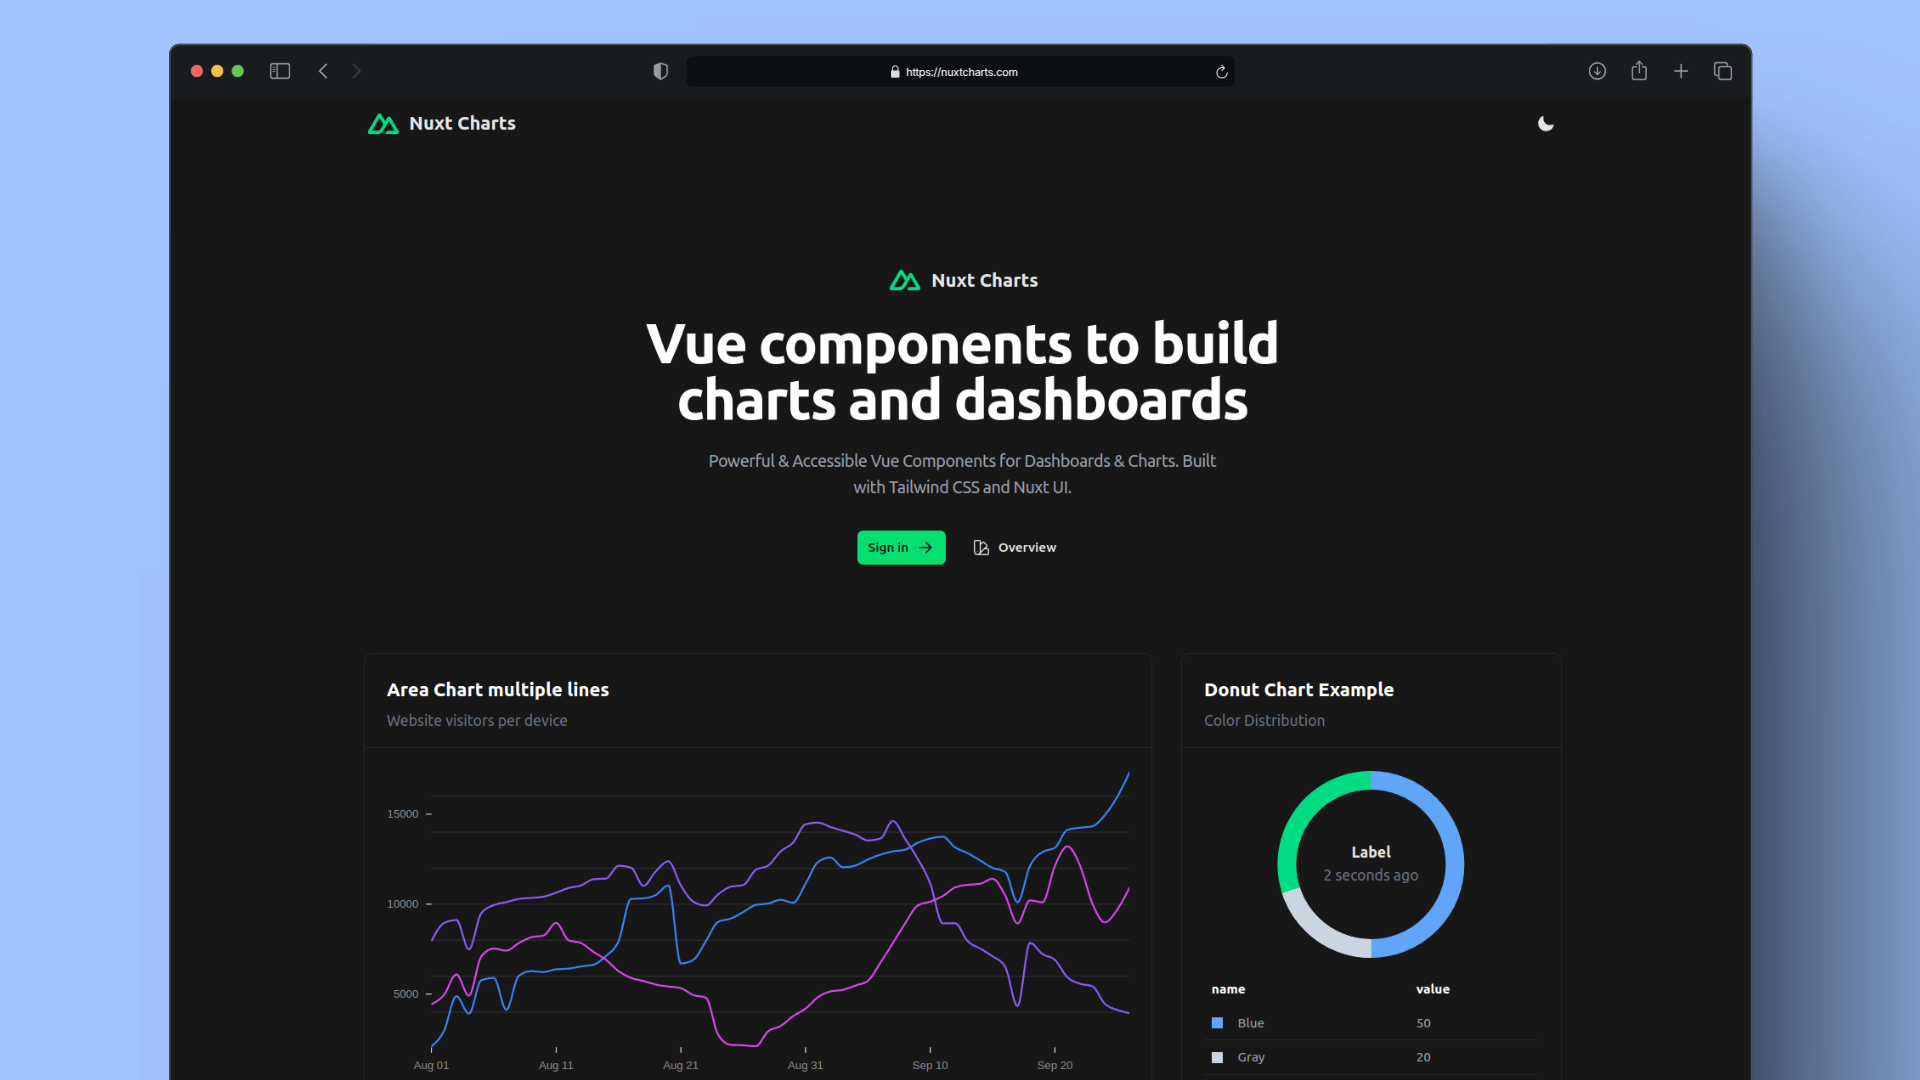
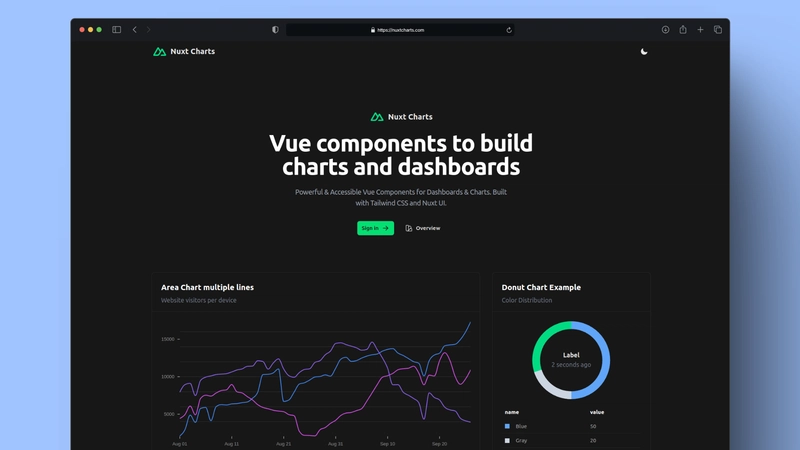
To create more options that combine great aesthetics with a smooth developer experience, I've created Nuxt Charts, a wrapper around vue-chrts—as a way to create beautiful charts in seconds.
Nuxt Charts:
- 📊 Multiple types: Line, Bar, Area, Donut
- 🎨 Easily customizable
- 💡 Simple, intuitive API
- 💚 Built for the Vue ecosystem
On top of Unovis, optimized for Nuxt UI.
It began with another project I was creating: Nuxt Error, an error logging dashboard specifically for Nuxt applications. As I designed the interface for Nuxt Error, the need for clear, informative, and visually appealing charts.
It became clear that I couldn't find any solutions other than React alternatives, which looked beautiful. But again, I'm 100% locked into the Vue/Nuxt ecosystem, so I had to figure something out.
Looking at the available options, and drawing inspiration from the richer selection often seen in React projects, I realized there was an opportunity. Why not build a charting package myself?
The focus of Nuxt Charts
Nuxt Charts is envisioned as a Nuxt package dedicated to helping developers build beautiful charts and dashboards with minimal friction, with the following core beliefs:
- Aesthetics: Provide modern, visually appealing chart components out-of-the-box.
- Developer Experience: Ensure seamless integration with Nuxt leveraging its features for an intuitive setup and usage.
- Customization: Offer sensible defaults but allow for easy customization to match diverse application designs.
- Focus: Concentrate specifically on being the best charting solution for the Nuxt ecosystem, rather than trying to be a generic, framework-agnostic library.
What validated this idea and gave the project great momentum was the reaction from the community. After the initial announcement, I was pretty surprised and excited to receive such support and encouragement from major figures within the Vue and Nuxt ecosystems.
Having people like Sébastien Chopin (creator of Nuxt), Evan You (creator of Vue), and many other fantastic developers express their enthusiasm and support is great motivation.
Nuxt Charts is currently under active development. The focus is on building a solid foundation, selecting the right underlying charting technology (or developing it), and ensuring the API feels natural, cosistent and powerful for Nuxt developers.
How to get started?
1. Install the module
pnpm add nuxt-charts
2. Add module to config
export default defineNuxtConfig({

   modules: ["nuxt-charts"]

});
Note If you're using pnpm, ensure that you set shamefully-hoist=true in your .npmrc file.
Check the docs and examples
Get Involved
This project aims to fill a perceived gap, driven by a personal need encountered while building other tools and validated by the broader community. If you're a Nuxt developer who has wished for better, easier, or more beautiful charting options, I hope Nuxt Charts will eventually be the solution you're looking for.
Keep an eye out for updates! As development progresses, there will be opportunities for feedback, contributions, and early testing. The enthusiasm from the community has been fantastic, and I'm excited to build this together.
