Sleep Pattern Analysis using .NET MAUI Toolkit Range Column Chart
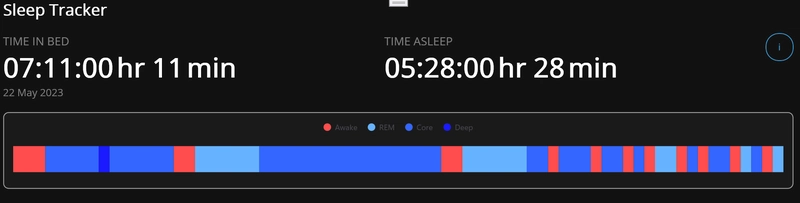
TL;DR: Learn to analyze sleep patterns using the .NET MAUI Range Column Chart. This guide walks you through setting up the .NET MAUI Toolkit, building a sleep tracker chart, analyzing weekly sleep tre...