Managing logs efficiently is critical for monitoring, troubleshooting, and security compliance in any modern IT environment. The ELK stack (Elasticsearch, Logstash, Kibana) provides a powerful, scalable, and real-time logging solution, whether deployed on-premise or in the cloud.
In this guide, I’ll walk you through how to design and deploy a centralized log management system using ELK, covering architecture, best practices, and key optimizations.
Why Centralized Logging?
Handling logs across multiple applications and servers can be a nightmare. A centralized logging system helps:
- Aggregate logs from multiple sources
- Ensure real-time monitoring and alerting
- Improve security compliance (e.g., encryption, access control)
- Optimize performance and storage
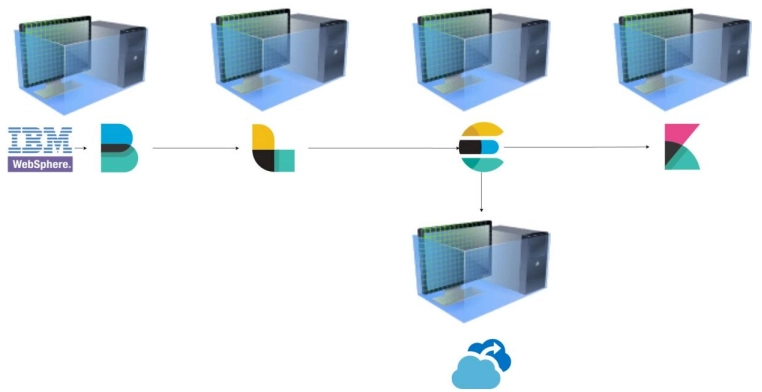
Architecture Overview: Key Components
A robust ELK architecture consists of multiple components working together:
- Filebeat → Collects logs from various sources
- Logstash → Processes, filters, and enriches log data
- Elasticsearch → Stores and indexes logs for fast retrieval
- Kibana → Provides real-time dashboards and analytics
- Backup & Security Measures → Ensures compliance and disaster recovery
Example Deployment (On-Premise or Cloud-based)
A large-scale financial institution handling millions of transactions daily requires centralized log management to track system activity, detect fraud, and ensure compliance with regulations like PSI-DSS and GDPR. The logging infrastructure must be scalable, resilient, and secure, capable of processing high volumes of structured and unstructured logs from multiple applications, security tools, and databases.

To meet these demands, the ELK stack is deployed across dedicated virtual machines (VMs) or containers with optimized resource allocation:
🖥 Virtual Machine for Elasticsearch
Elasticsearch is the core of the ELK stack, handling indexing and search. It is resource-intensive, especially when processing a large volume of logs.
Recommended Specs:
- vCPU: 16 vCPUs (scalable based on log volume and queries)
- RAM: 64 GB (benefits from large heap size)
- Storage: 2 TB SSD (adjustable based on retention and log volume)
- OS: RHEL, Ubuntu, or any Linux-based production-optimized OS
-> Justification:
Elasticsearch requires high memory and fast storage for indexing and queries. Depending on data volume, adding more storage or clustering nodes can enhance fault tolerance and scalability.
🖥 Virtual Machine for Logstash
Logstash processes, filters, and enriches logs before forwarding them to Elasticsearch. Complex pipelines can be CPU and memory-intensive.
Recommended Specs:
- vCPU: 8 vCPUs
- RAM: 16 GB
- Storage: 500 GB SSD (lower storage needs than Elasticsearch)
- OS: RHEL or Ubuntu
-> Justification:
CPU and RAM usage depends on log volume and pipeline complexity. Heavy filtering or data enrichment increases resource consumption.
🖥 Virtual Machine for Kibana
Kibana provides visualization and analytics, but it requires fewer resources compared to Elasticsearch and Logstash.
Recommended Specs:
- vCPU: 4 vCPUs
- RAM: 8 GB
- Storage: 100 GB SSD (minimal storage requirements)
- OS: RHEL, Ubuntu, or any Linux-based system
-> Justification:
Kibana mainly handles dashboard rendering and visualization queries. Resource needs increase with more users and complex visualizations.
📌 Filebeat (Lightweight Log Shipper)
Filebeat is a lightweight agent that collects and forwards logs to Logstash or Elasticsearch.
-> Justification:
Filebeat is resource-efficient and has minimal processing overhead. It can be deployed on multiple servers depending on the log sources.
🖥 Virtual Machine for Backup Server
A backup server stores Elasticsearch snapshots and automated backups to ensure data integrity and recovery.
Recommended Specs:
- vCPU: 4 vCPUs
- RAM: 16 GB (low RAM requirements since backups are storage-intensive)
- Storage: 4 TB HDD (encrypted)
- OS: Ubuntu Server, CentOS, or RHEL
-> Justification:
- Backup storage does not require fast SSDs—high-capacity HDDs are sufficient.
- Backup strategies include snapshots, rotation policies, and periodic recovery tests.
Key Benefits of This Architecture
- Resource Isolation → Each component runs on its own VM, ensuring one service’s workload doesn’t impact others.
- Scalability → Each component can be scaled independently (e.g., Elasticsearch can be expanded as log volume grows).
- High Availability & Fault Tolerance → Elasticsearch can run as a cluster with multiple nodes, and backups ensure data security.
- Security Best Practices → Separate VMs allow granular firewall rules and network policies, restricting communication between components.
Data Flow & Processing
Step 1: Log Collection with Filebeat
- Filebeat runs on source servers (applications, databases, containers).
- Sends logs to Logstash or directly to Elasticsearch.
Step 2: Processing with Logstash
- Filters and enriches logs (e.g., adds metadata, geo-location, or obfuscates sensitive data).
- Outputs to Elasticsearch for storage.
Step 3: Indexing & Storage in Elasticsearch
- Optimized for fast queries and scalable storage.
- Index lifecycle management ensures log retention policies.
Step 4: Visualization & Alerting with Kibana
- Dashboards provide real-time insights.
- Alerts notify teams of anomalies or system failures.
Security & Compliance Considerations
Ensuring a secure logging infrastructure is crucial for data protection and regulatory compliance (e.g., SOC2, GDPR, PSI-DSS). Key practices include:
Data Encryption
- In Transit: All communication between Filebeat, Logstash, Elasticsearch, and Kibana is secured using SSL/TLS certificates to prevent data interception.
- At Rest: Log indices in Elasticsearch are encrypted using the X-Pack security module, and physical disks on servers are also encrypted to protect stored data.
Authentication & Access Control
- Role-Based Access Control (RBAC): Permissions are managed based on user roles, ensuring restricted access to logs only for authorized personnel.
- LDAP / Active Directory Integration: Centralized authentication management allows seamless user provisioning and control.
- Multi-Factor Authentication (MFA): Enforced for Elasticsearch and Kibana administrators to enhance security against credential theft.
Access Logging & Monitoring
- Audit Logging: User activities and system interactions in Elasticsearch and Kibana are logged for traceability.
- Unauthorized Access Monitoring: Failed login attempts and unusual modifications are actively monitored to detect potential security threats.
Additional Security Measures
- Log Retention Policies: Automatic log purging using Index Lifecycle Management (ILM) ensures compliance with data retention regulations.
- Backup & Disaster Recovery: Regular Elasticsearch snapshots ensure data availability and protection against loss or corruption.
- Network Security & Isolation: Strict firewall rules and network segmentation prevent unauthorized access between components.
Deployment & Automation Best Practices
Infrastructure as Code (IaC)
- Automate deployment using Ansible, Terraform, or CI/CD tools.
Scaling Strategy
- Deploy Elasticsearch as a cluster for high availability.
- Optimize sharding & indexing for better performance.
- Use log filtering to reduce unnecessary data ingestion.
Monitoring & Performance Tuning
- Leverage Elasticsearch monitoring tools (Kibana Stack Monitoring, Grafana).
- Tune heap size & JVM settings for optimal resource allocation.
Why You Should Build a Scalable ELK Stack?
A well-designed ELK stack enables organizations to streamline log management, improve security, and gain valuable insights from their data. Whether deployed on premise or cloud, following best practices ensures scalability, performance, and compliance.