Table of Contents
Introduction
In this small post, I'll share some resources, notes I've taken while learning, and best practices for making our systems observable. I've always had a knowledge gap regarding observability, and recently I've truly enjoyed learning more about this area in our software industry.
Quick note: In this post I'll only share about 3 telemetry signals. Profile is another signal that I will research in the future.
Get Started
Follow these steps to get started with auto-instrumentation in your application using OpenTelemetry: https://opentelemetry.io/docs/languages/net/getting-started/#instrumentation
For OpenTelemetry in a front-end app you can check these useful resources:
Client-side instrumentation in OpenTelemetry is part of their roadmap which is great to see, since I've only seen vendor-specific solutions and products for front-end apps (e.g. New Relic, Datadog). For browser instrumentation otel doesn't seem to be super mature yet, but a lot of effort is being put into this area by the OpenTelemetry team.
Logs
We all know about logs 😄. It's data that we all need in order to troubleshoot and know what is happening in our applications. We shouldn't overdo it, creating tons and tons of logs since that will probably create noise and make it harder to troubleshoot problems.
For logs, we can use these best practices. From this list, these are an absolute must to follow:
- Avoid string interpolation
- Use structured logging
- Log redaction for sensitive information
In addition to the list above, we should also include the TraceId and SpanId in our log records, to correlate logs with traces. If you are using the Serilog console sink, by default the message template won't have those fields so if you want them, consider using JsonFormatter or CompactJsonFormatter. Here is an example Serilog configuration in appsettings.json (setup to remove unnecessary/noisy logs):
"Serilog": {
    "Using": [
      "Serilog.Sinks.Console"
    ],
    "MinimumLevel": {
      "Default": "Information",
      "Override": {
        "Microsoft.AspNetCore": "Warning",
        "Microsoft.Extensions.Diagnostics.HealthChecks": "Warning"
      }
    },
    "WriteTo": [
      {
        "Name": "Console",
        "Args": {
          "formatter": {
            "type": "Serilog.Formatting.Json.JsonFormatter, Serilog",
            "renderMessage": true
          }
        }
      }
    ],
    "Enrich": [
      "FromLogContext",
      "WithMachineName",
      "WithThreadId",
      "WithProcessId",
      "WithProcessName",
      "WithExceptionDetails",
      "WithExceptionStackTraceHash",
      "WithEnvironmentName"
    ],
    "Properties": {
      "Application": "GrafanaDemoOtelApp"
    }
  }
Below are some documentation links for logging in .NET. The ILogger extension methods are not always the best choice (e.g. logger.LogInformation), especially in high-performance scenarios or if your logs are in a hot path:
Canonical logs
There is also a different way of logging, based on having more attributes in one single log line. I've seen this in Stripe where they call it canonical log lines. Charity Majors also references this canonical logs term in her blog post about Observability 2.0 (that I reference in the Resources section).
This idea is very interesting, but might lack awareness. At least in .NET land, I didn't find many references to this style of logging or example code that we could follow when there are many ILogger instances involved.
Traces
For traces in .NET we have these best practices. So far I've seen four common solutions for adding correlation ids in traces (not all are standards):
- W3C trace context - current standard in the HTTP protocol for tracing
- X-Correlation-Id - a non-standard HTTP header for RESTful APIs (also known as X-Request-Id). I thought this was a standard since it's widely used, but I didn't find an RFC from IETF or any other organization.
- Request-Id - this is a known header in the .NET ecosystem
- B3 Zipkin propagation - Zipkin format standard
- AWS X-Ray Trace Id - proprietary solution for AWS that adds headers for tracing
Not every company/project uses W3C trace context, you have some options above to pick from. I prefer the standard W3C trace context 😄 (maybe the industry will widely adopt this in the future) and using OpenTelemetry to manage these headers (HTTP, AMQP, etc) and correlation with logs automatically. The code you don't write can't have bugs 😆.
With that said, in some situations, you might have integrations with 3rd party software and need to use their custom headers or project limitations and need to use a particular format. At the end of the day what's important is that you have distributed tracing working E2E.
There is also a relevant spec for distributed tracing called Baggage which OpenTelemetry implements and we can use in our apps. The most important part here is trace propagation to get the full trace from the publisher to the consumer.
Metrics
For metrics, it's important to follow naming conventions for custom metrics. Especially if your organization has a platform team, setting conventions helps everyone. I do know some otel semantic conventions aren't stable, and that also leads to some nuget packages being pre-release.
But anyhow, set conventions for your team or read and follow OpenTelemetry semantic conventions.
An important resource I found is the comments on Prometheus best practices related to high cardinality metrics.
When I started trying out custom metrics instrumentation I discovered that OpenTelemetry is not always used (the SDK + OTLP). We have the Prometheus SDK which is mature and widely used. Then for Java there are other solutions like Micrometer and others that integrate very well with Spring. In regards to the Java ecosystem, I read this otel Java benchmarks and this Spring post just because I was interested in knowing what the industry is adopting and why.
General Best Practices
There is a ton to be learned with SRE principles and practices. But one in particular was very useful for me and my team: always categorize our custom metrics according to the 4 Golden Signals. Any metric we can't categorize is probably not useful for us.
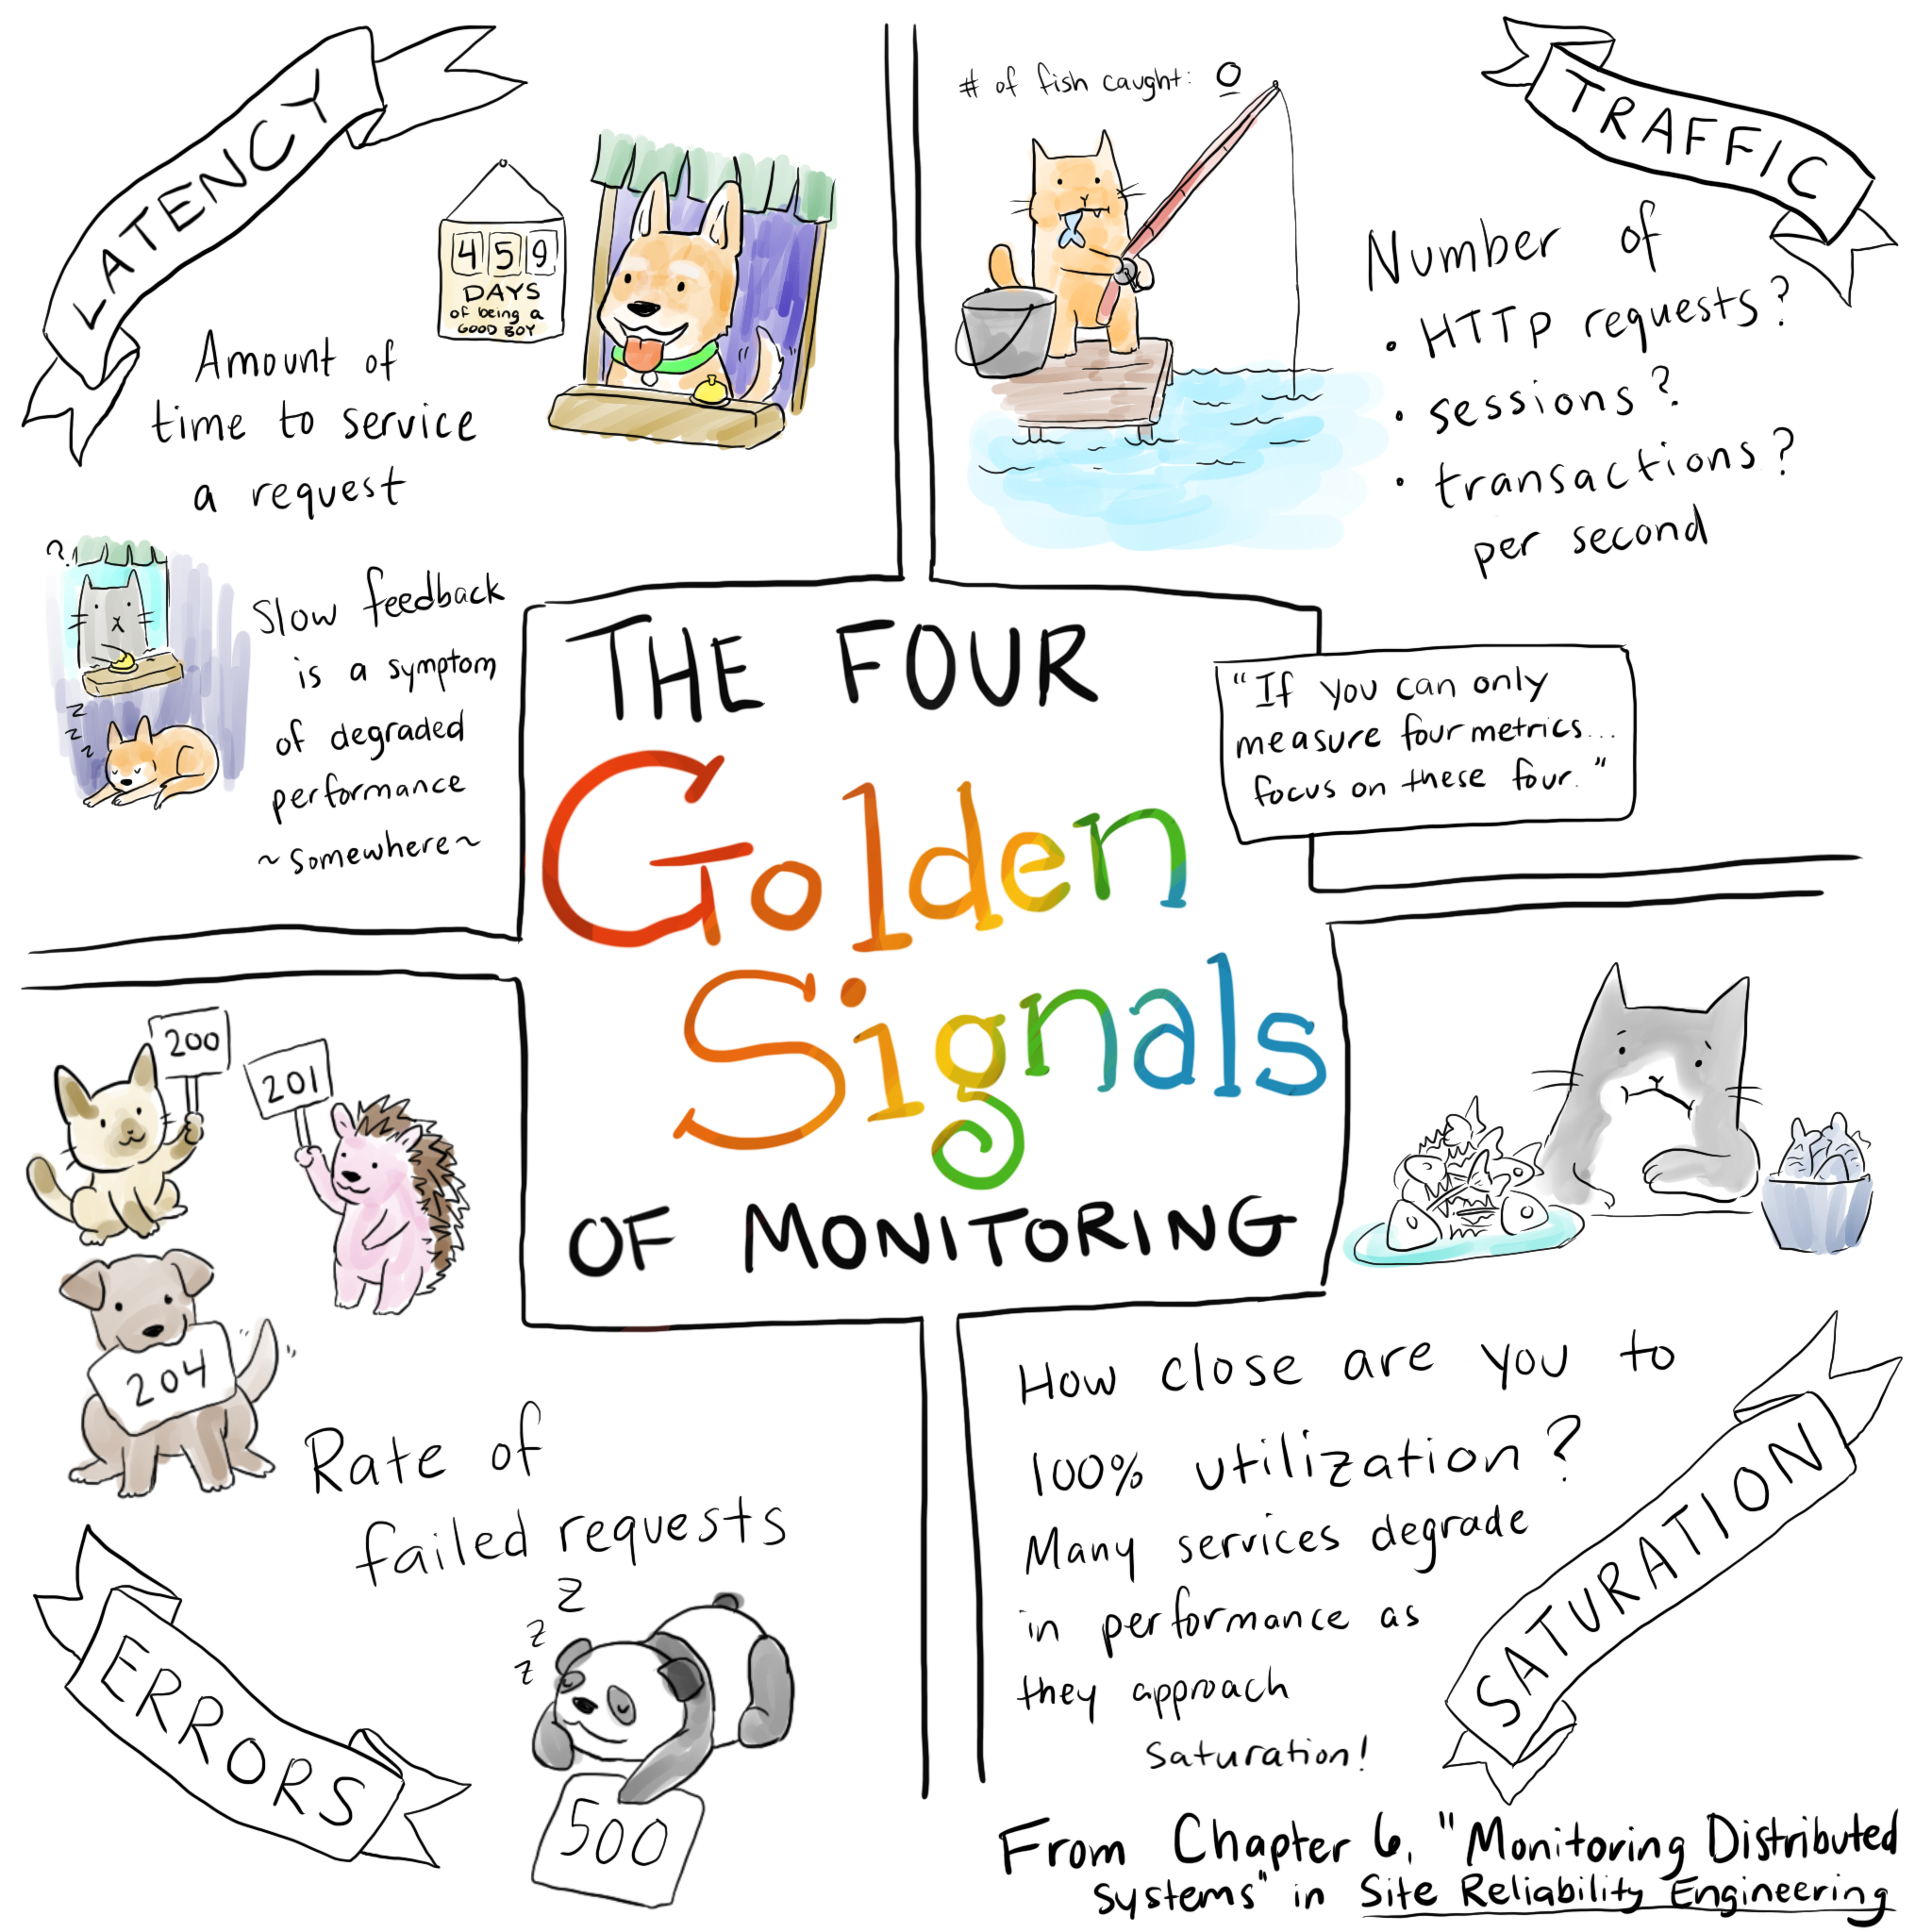
Google's SRE book is amazing to learn more about the 4 Golden signals and creating SLO-based alerts. All our alerts should be actionable (or the support team will not be happy), so it helps if they are based on SLOs that are defined as a team.
They also have some best practices for production services.
Resources
- Glossary of many observability terms in case you’re not familiar with them: https://github.com/prathamesh-sonpatki/o11y-wiki
- Awesome Observability GitHub repo
- If dashboards make you happy check the Grafana observability report dashboard
- AWS observability best practices guide
- About RED and USE method
- Traces Instrumentation best practices in .NET
- What are the Limitations of Prometheus Labels?
- CNCF OpenTelemetry certification
- TAG Observability whitepaper - this is an amazing resource with tons of information! I also recommend checking out the other resources they have in the tag-observability repo and community
- Resources specifically about Observability 2.0:
- Talks
- How Prometheus Revolutionized Monitoring at SoundCloud - Björn Rabenstein
- How to Include Latency in SLO-based Alerting - Björn Rabenstein, Grafana Labs
- Myths and Historical Accidents: OpenTelemetry and the Future of Observability Part 1
- Modern Platform Engineering: 9 Secrets of Generative Teams - Liz Fong-Jones
- Context Propagation makes OpenTelemetry awesome
GitHub demo repo
I've been developing a demo app (it has fewer features than the otel demo) to demonstrate how to build an app with OpenTelemetry, Grafana and Prometheus. It's primarily focused on a small app I can showcase in my talks.
If you're interested take a look:
 BOLT04
/
grafana-observability-demo
BOLT04
/
grafana-observability-demo
Repo with grafana and observability related demo app
Observability - Grafana Demo for Talks
This is a simple demo showcasing how we can instrument our applications with OpenTelemetry, using Azure Monitoring + Grafana + Prometheus It's intended to be used as the demo of a specific talk about observability.
Demo app instructions
Read the instructions in src/README.md.
Session Abstract
Nowadays OpenTelemetry is used extensively to collect telemetry data from our applications, and serves as an industry standard. But we need a way to visualize this data in a clear way, and that is where Azure Managed Grafana comes in.
In this session we'll go through the core concepts of observability and demonstrate how we can use Azure Managed Grafana, integrated with Prometheus Grafana Tempo and Loki to gather insights from our telemetry data We will cover topics such as the basics about logs, metrics and traces, manual instrumentation, OTLP, and others. We'll talk about other interesting OpenTelemetry…
Conclusion

Hopefully, some of these resources I've shared are useful to you 😄. I still have a ton to learn and explore, but I'm happy with the knowledge I've acquired so far.
There are some specific standards + projects that I'll dive in and explore more, like: eBPF; OpenMetrics. OpenMetrics is something I'd like to spend some quality time reading about, but I know it's archived and reddit says the same. Just want to read and watch some talks about it to feed my curiosity 😃.
Last but not least, I want to follow the work that some industry leaders are doing like Charity Majors, specifically about Observability 2.0 😄. I discovered this term in the Thouthworks tech radar, and the part "high-cardinality event data in a single data store" caught my interest.
I'm still learning, researching, and listening to the opinions of industry leaders about this term to then develop my own opinions. Maybe I'll make a blog post about this in the future 😁.