The problem
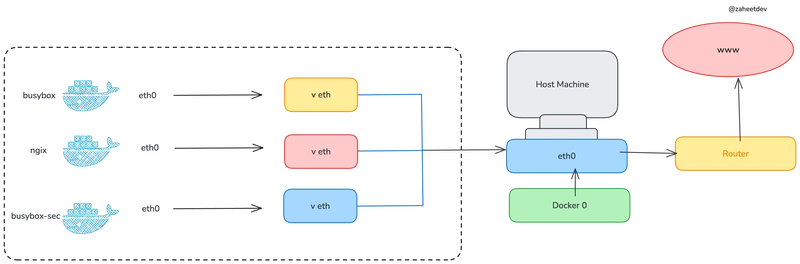
Once upon a time, Docker decided to spoil us all developers and operators and had unlimited access to Docker Hub. You could pull as many images, as many times as your heart desired without any constraint, so we got used to it and never really thought about how good of a deal was that.
Unfortunately, free and unlimited almost never go hand to hand and the day came when Docker decided to impose limits to how much you can pull from the mothership. At this point (April 2025) the limits have changed twice and the current numbers can be found at https://docs.docker.com/docker-hub/usage/.
Many of us just created users for those machines with heavy docker pull usage and for most of it, it was fine. Until eventually something breaks. We started using caches where possible, but in some cases, the need for direct access was still there and therefore the need to know how much more can we pull for now and if any account had run dry.
Prometheus + Alertmanager + Grafana
If you've been operating services for the last decade, chances are you've meet these tools.
For the uninitiated:
- Prometheus is used to collect metrics of your systems over time.
- Alertmanager Takes care of handling alerts and distributing them to the right receiver.
- Grafana Is used to visualize metrics, logs, traces, and by the time you read this probably other things 😄
These tools are widely used by operations teams as the backbone for monitoring and alerting and are the de facto standard in my opinion. This is not a tutorial about these tools specifically but I will explain how to pull the data into the tools and configure dashboards and alerts.
Prometheus exporters
Now, how do we get these metrics you ask? Well, we need to use a Prometheus exporter. This one specifically: https://github.com/jadolg/dockerhub-pull-limit-exporter.
Prometheus itself doesn't directly integrate with every service. Exporters are services that get information from other software/services and expose in a format that Prometheus understands. Once active, you can add the exporter as a target to your Prometheus server and it will start scraping metrics from it periodically.
Installing
The best and fastest way in my opinion to deploy the exporter is using docker compose. In your server (that already has docker and docker compose available), create a directory to place the configuration:
mkdir dockerhub-pull-limit-exporter
cd dockerhub-pull-limit-exporter
Download the example configuration
wget -O config.yaml https://raw.githubusercontent.com/jadolg/dockerhub-pull-limit-exporter/refs/heads/main/config.example.yamlAnd replace the example credentials with yours. You can add as many accounts as your heart desires.
You can also adjust the interval in which the exporter gets its information from DockerHub and the timeout for these requests.
Once the configuration is in place, We need a docker compose file.
services:
  dockerhub-pull-limit-exporter:
    image: ghcr.io/jadolg/dockerhub-pull-limit-exporter
    restart: unless-stopped
    ports:
      - 9101:9101
    volumes:
      - ./config.yaml:/config.yaml
Save it into the same directory and start the service:
docker compose up -dPrometheus
And now it's time to setup Prometheus. There are many ways to do this since there are many ways to install Prometheus in the first place, but the general idea is the same. We need to add the exporter as a target to our Prometheus server so it knows what to scrape. Edit your Prometheus configuration and add the following target to your scrape_configs replacing my-server with your server's address:
scrape_configs:
- job_name: 'dockerhub_pull_limit_exporter'
static_configs:
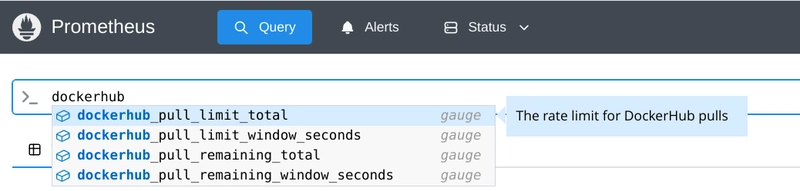
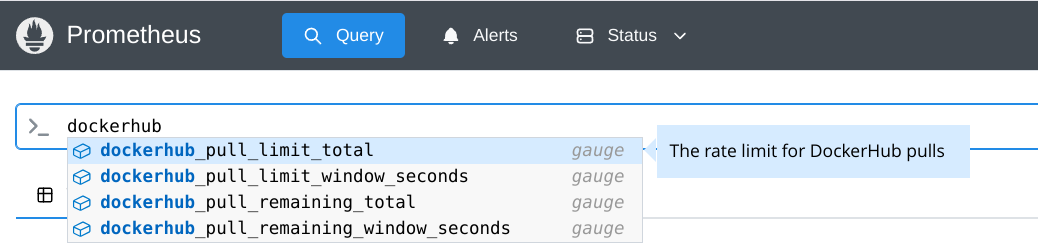
- targets: ['my-server:9101']After restarting Prometheus, the new metrics should available.
Grafana
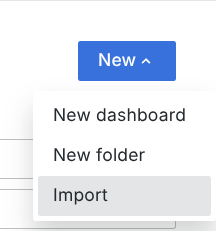
Now let's see what the metrics have to say. Head on to your Grafana and in the Dashboards section click New/Import:
In the Import view use ID 23342 (created specifically for this exporter) and click Load and then Load (Weird choice of options, I know).
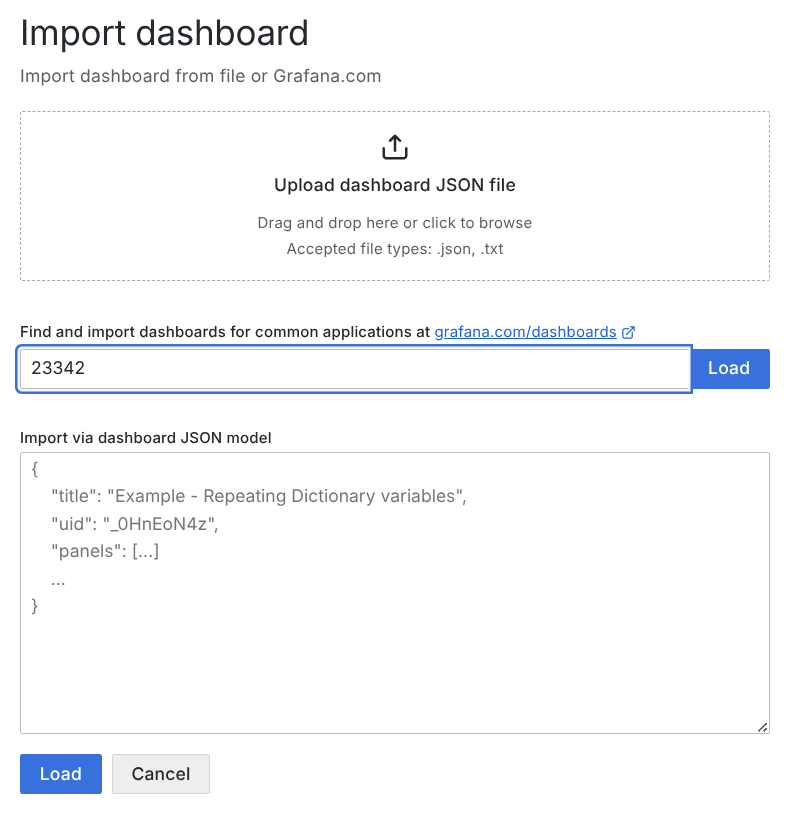
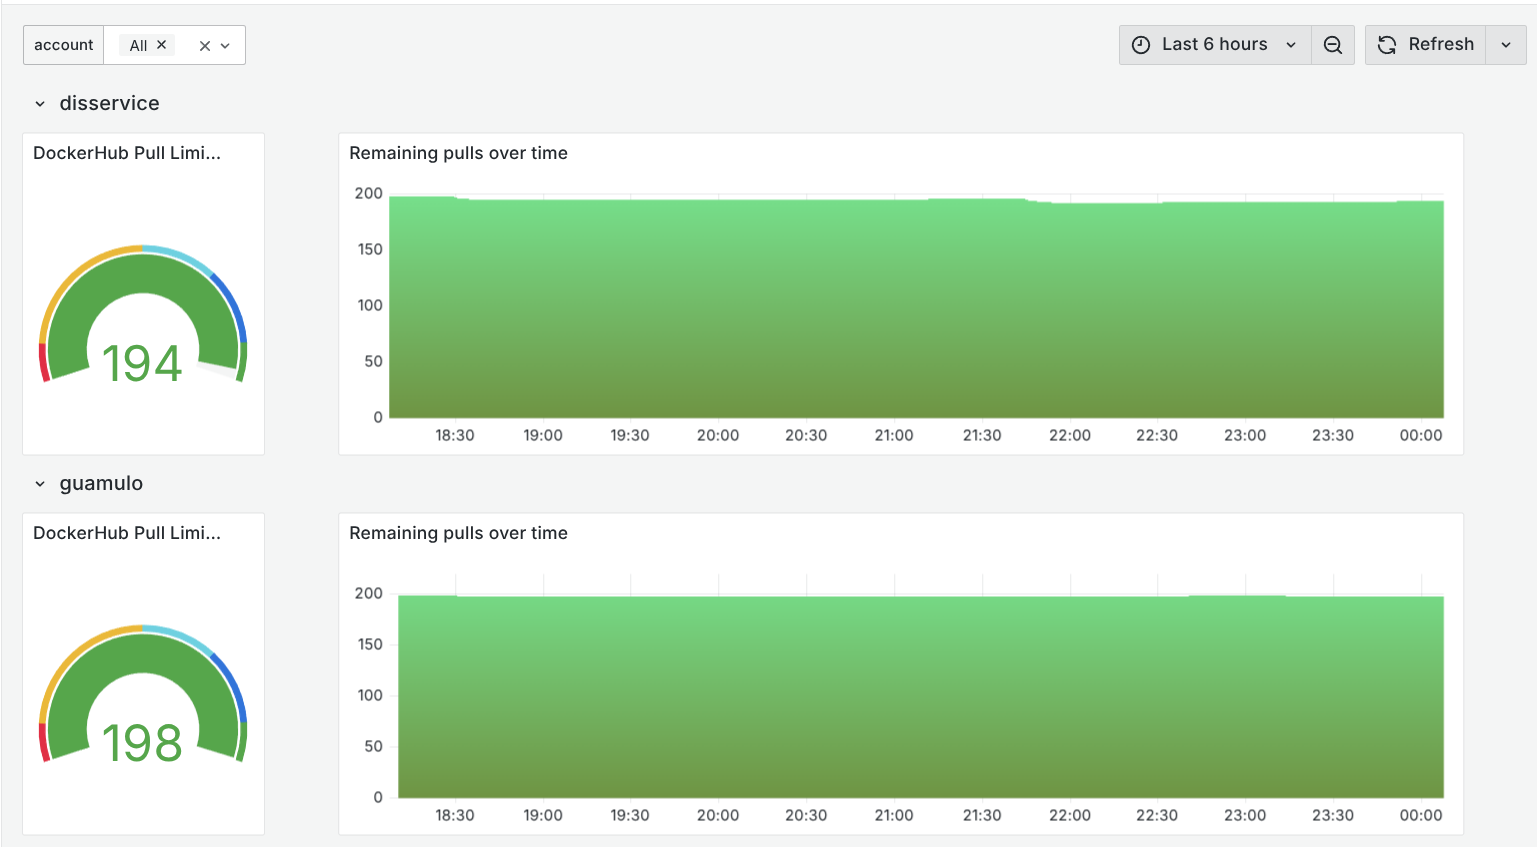
If everything goes right and your metrics are available you should be greeted by a shinny new dashboard like mine:
Alerts
Now we are collecting the data and we are able to see it but we need to get alerted when our limits are running low. In order to do that we need to add a new rule file to our Prometheus configuration:
rule_files:
  - "alerts.dockerhub.rules.yml"
And in that file we'll add the following alerts:
groups:
  - name: DockerHubPullLimits
    rules:
      - alert: DockerHubPullsRemainingLow
        expr: dockerhub_pull_remaining_total/dockerhub_pull_limit_total * 100 < 10
        for: 5m
        labels:
          severity: warning
        annotations:
          summary: "Account {{ $labels.account }} has used 90% of its pull limit"
      - alert: DockerHubPullsRemainingLowCritical
        expr: dockerhub_pull_remaining_total < 1
        for: 5m
        labels:
          severity: critical
        annotations:
          summary: "Account {{ $labels.account }} has used 100% of its pull limit"
Restart Prometheus and the alerts should be loaded.
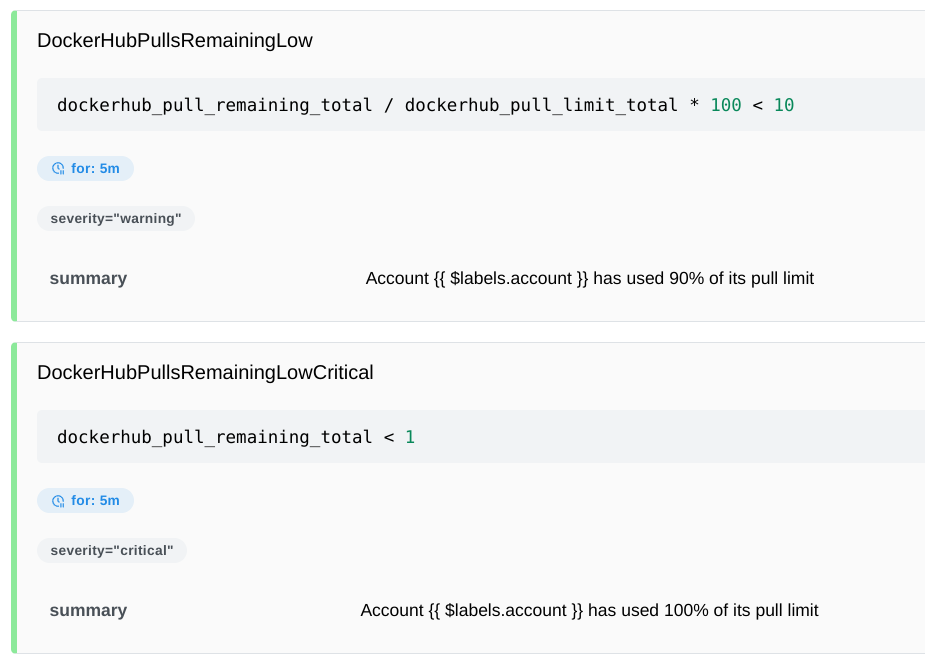
These alerts will be triggered when the accounts have used 90% of the current limit and then when they have used 100%.
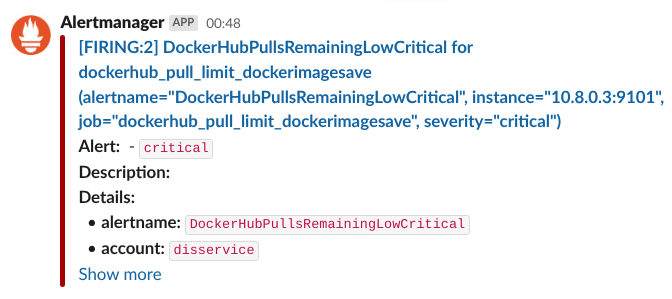
Next, configure Alertmanager to route this alert to your favorite notification channel and alerts will get to you when they trigger.
Final words
Collecting metrics is an essential part of operating any software system. It's the window to your service's health and performance, and should be the main tool to use to diagnose when things go wrong. If there's a problem, there should be an alert for it and that alert should be based on metrics.
With all this in place, the next time my services run out of docker pulls, I will know immediately, and if they are failing, I will have all the information I need to know if this is the cause. I will also have historical data which I'll be able to analyze to know what the trending usage is and be ready to improve my setup based on that data.
And that's all for today folks! Happy monitoring!