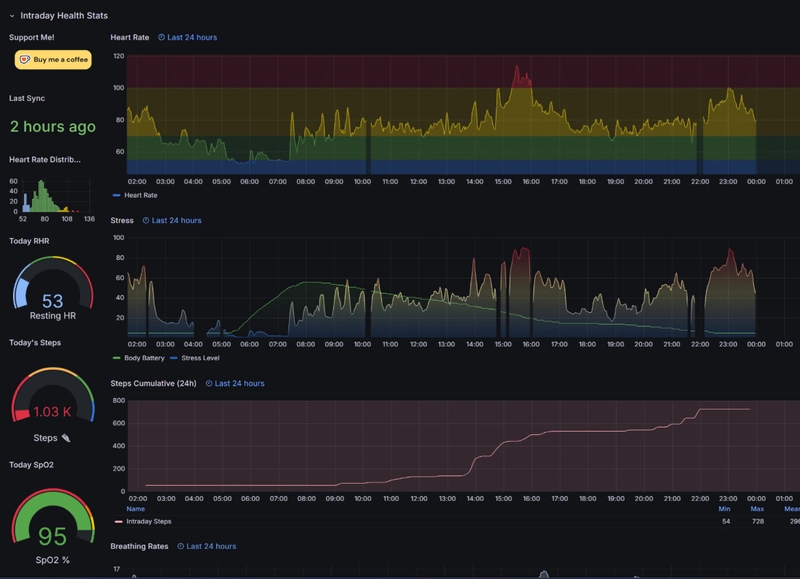
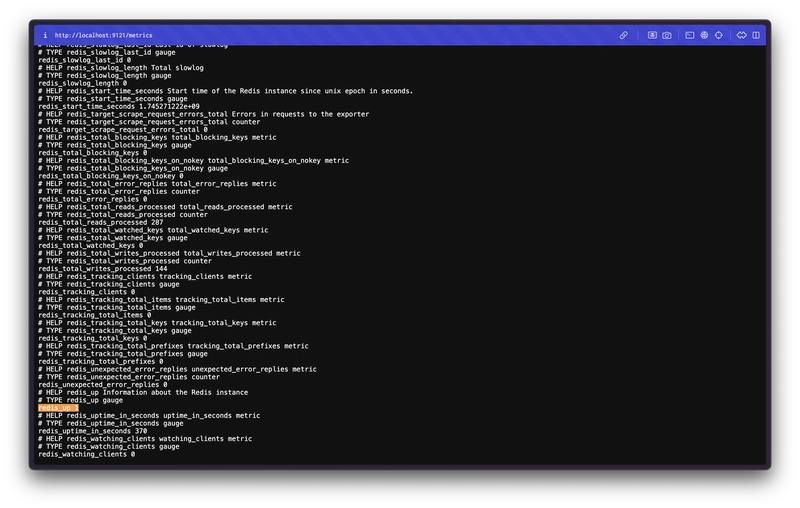
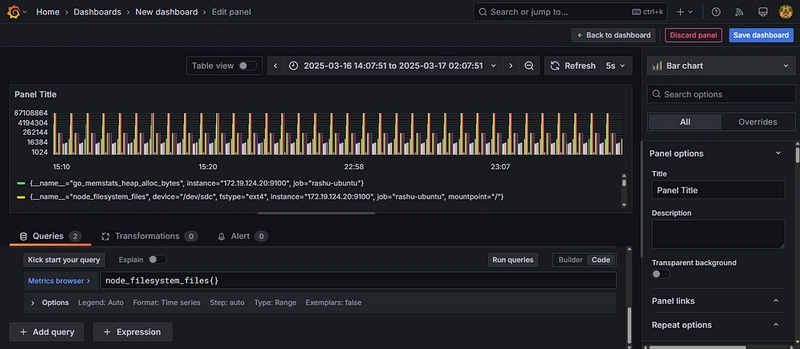
Visualize System Metrics with Grafana & Prometheus in Docker
Follow the link to the Github Repo:- https://github.com/vak-rashu/Docker/tree/main/Prometheus-and-Grafana-with-Docker
Prometheus and Grafana are two main tools that are used to monitor, analyse and v...